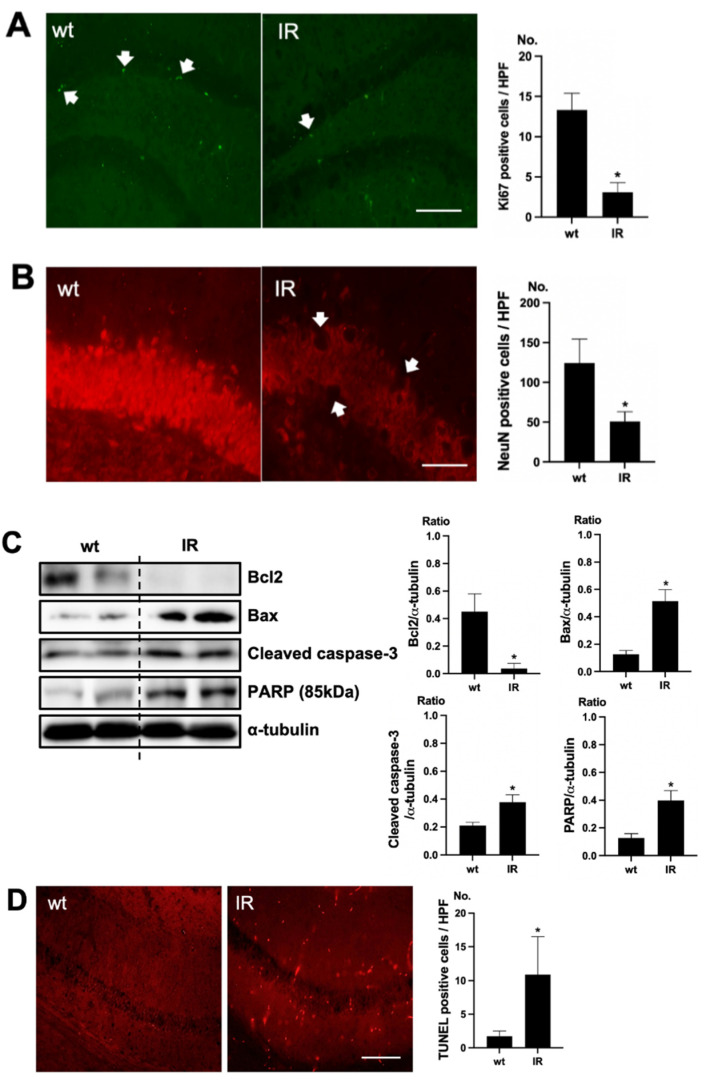
Figure 2.
Brain damage in ischemia-reperfusion (IR) kidney. (A) Representative immunofluorescence stain of subgranular zone of the hippocampal DG of brain section: Immunofluorescent staining was performed using the markers of proliferation (Ki67) in brain. High power field (HPF), original magnification, 200×. Scale bar = 50 μm. (B) Representative immunofluorescence stain of subgranular zone of the hippocampal DG of brain section: Immunofluorescent staining was performed using the neuronal nuclei marker (NeuN) in the brain. Original magnification, 400×. Scale bar = 200 μm. (C) Representative Western blot of brain lysis: Western blot analysis shows renal injury—increased Bax, cleaved caspase3 expression, and decreased Bcl2 expression in the brain of uremic mice. Renal injury increased PARP (85 kDa) expression in the brain of uremic mice. (D) Representative TUNEL stain of subgranular zone of the hippocampal DG of brain section. Original magnification, 200×. Scale bar = 50 μm. * p < 0.001 vs. wt. Bar represents mean ± S.D. (wt, wild-type sham; IR, IR renal injury in wild-type mice).

