Figure 3.
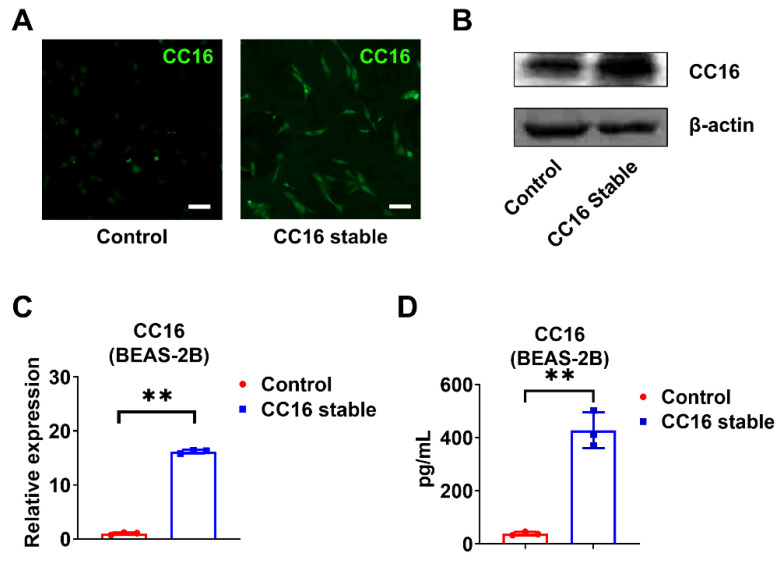
Development of stable BEAS-2B cells overexpressing CC16. (A) Immunofluorescence staining images of CC16 were captured in control BEAS-2B and BEAS-2B-CC16. (B) The protein expression of CC16 was analyzed by Western blot. (C) The mRNA levels of CC16 in BEAS-2B and BEAS-2B-CC16 were measured by real-time PCR. (D) The protein levels of CC16 in BEAS-2B and BEAS-2B-CC16 were analyzed by ELISA. Scale bars, 100 µm. Results represent mean ± SD of 3 independent experiments. ** p < 0.01.

