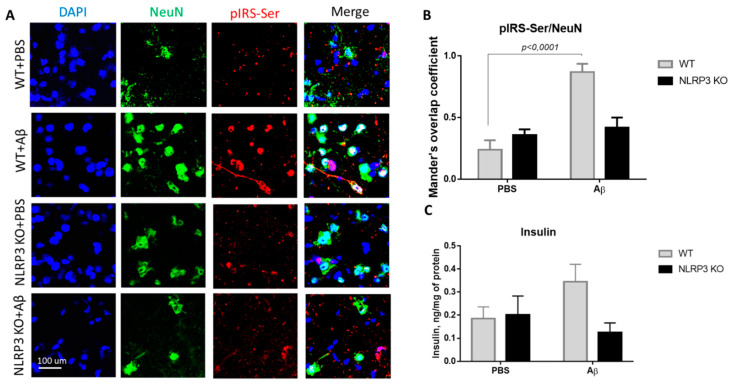
Figure 5.
Results of insulin and serine phosphorylated insulin receptor substrate (pIRS-Ser) measurements. (A) Representative confocal images of pIRS-Ser-expressing neurons and stained for DAPI (blue), NeuN (green), pIRS-Ser (red), signal overlay (merge). Scale Bar 100 µm. (B) The Mander’s overlap coefficient in pIRS-Ser+ and NeuN+ double labeling cells. Data are presented as means ± SEM, two-way ANOVA. (C) Insulin measurement in homogenates of the amygdala (ng/mg of protein). WT—wild type control mice, NLRP3 KO—NLRP3 knockout mice, Aβ—amyloid beta injection, PBS—phosphate buffered saline injection (sham operation).

