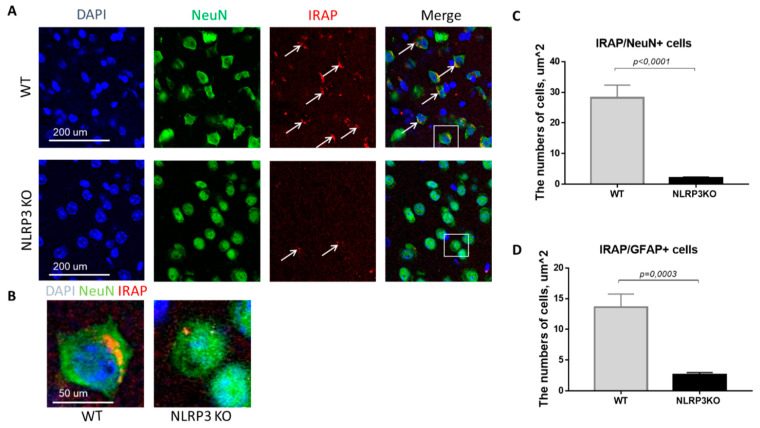
Figure 9.
Expression of IRAP in mature neurons and astrocytes of the basolateral amygdala in mice. (A) Triple immunofluorescent staining: cell nuclei—DAPI (blue), NeuN (green), IRAP (red), signal overlay (Merge). Scale Bar—200 µm. (B) Overlay of signals: cell nuclei DAPI (blue), NeuN (green), IRAP (red). Scale Bar—100 µm. (C) Number of IRAP/NeuN + cells. (D) Number of IRAP/GFAP + cells. WT—control mice group, NLRP3KO—NLRP3 knockout mice. Data are presented as a mean ± SEM.

