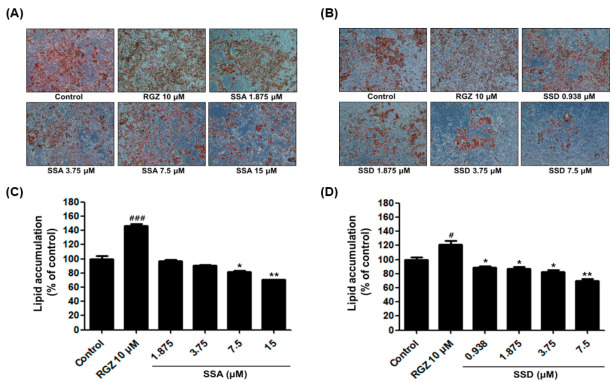
Figure 2.
Effect of SSA and SSD on lipid accumulation in 3T3-L1 cells. (A,B) Representative cell images were captured at 100 × magnification. (C,D) The lipid droplets were stained Oil Red O solution and extracted using isopropanol. Then, they were quantified using a microplate reader at the wavelength of 520 nm. Data are presented as a percentage of control (0.5% DMSO) and RGZ (rosiglitazone) was used as a positive control for this experiment. Results are mean ± standard error of the mean (SEM, n = 3); * p < 0.05, ** p < 0.01, # p < 0.05, ### p < 0.001, compared with control. #: increased compared to control, *: decreased compared to control.

