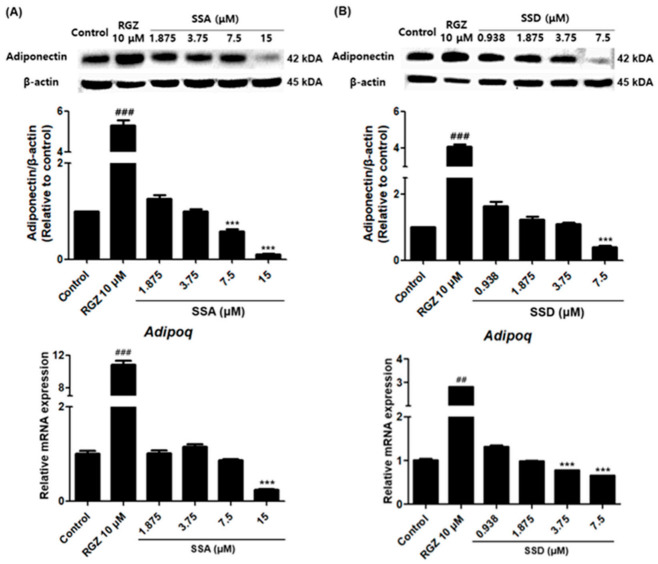
Figure 5.
Effect of SSA (A) and SSD (B) on the expression protein and mRNA levels of adiponectin in 3T3-L1 cells as measured by Western blot and quantitative real-time PCR, respectively. Results are shown as a relative of control (0.5% DMSO) values and RGZ (rosiglitazone) was used as a positive control for this experiment. β-actin was used as a loading control and Gapdh was used as a house keeping gene. Target gene mRNA levels were normalized to Gapdh using the 2-ΔΔ Ct method. Data are mean ± standard error of the mean (SEM) of three independent experiments. Results are mean ± standard error of the mean (SEM) of triplicate experiments. *** p < 0.001, ## p < 0.01, ### p < 0.001, compared with control, #: increased compared to control, *: decreased compared to control.

