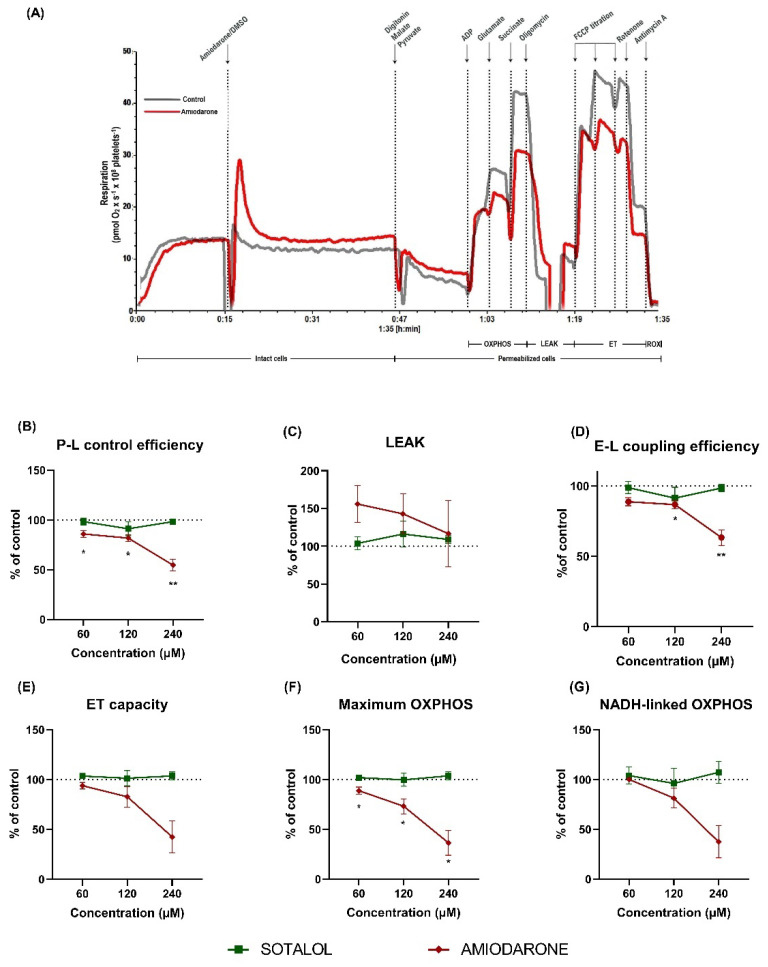
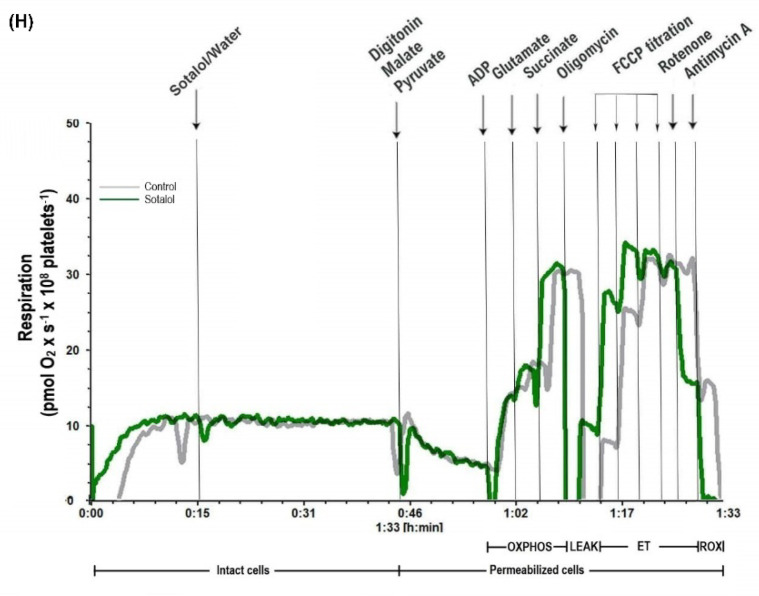
Figure 2.
Amiodarone (but not sotalol) induced a concentration-dependent inhibition of mitochondrial respiration in permeabilized platelets. (A) Representative trace of amiodarone-induced mitochondrial dysfunction (amiodarone-red; DMSO/solvent-grey). Concentration-dependent effects were assessed for 3 doses (60 µM, 120 µM and 240 µM) of amiodarone (red rhombus) and sotalol (green square), respectively. P-L control efficiency, a measure of ATP generating respiration (B), LEAK (C), E-L coupling efficiency, a measure of ATP generating respiration (D), ET capacity (E), maximum OXPHOS (F), NADH-linked OXPHOS (G) were evaluated. (H) Representative trace of sotalol effects (sotalol-green; H2O/solvent-grey). Data were expressed as mean ± SEM of the percent of control (platelets exposed to the corresponding volume of DMSO and H2O for highest concentration of drug). Two-way ANOVA with Bonferroni post hoc test was performed on the antimycin-corrected data. DMSO: dimethyl sulfoxide. ADP: adenosine diphosphate. FCCP: carbonyl cyanide p-(trifluoromethoxy) phenylhydrazone. OXPHOS: oxidative phosphorylation. LEAK: non-phosphorylating respiration. ET: electron transfer. ROX: residual oxygen consumption. * p < 0.05, ** p < 0.01 vs. control. n = 5.


