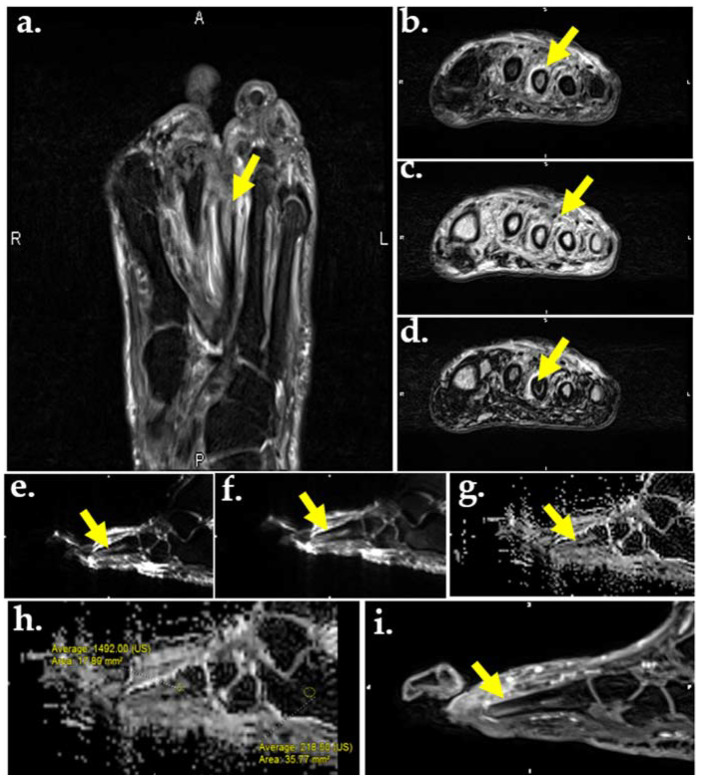
Figure 5.
MR images of the foot in a 56-year-old male with DM and plantar ulcer with plantar ulcer below the 3rd metatarsal and suspected OM. Prior fracture deformity of the second metatarsal head and surgical resection of the third metatarsal are noted. T2-weighted fat suppressed image (a) and T2 Dixon water map (b) show marrow edema of the third metatarsal stump (arrows). In-phase T2 Dixon map (c) shows muscle fatty replacement from DM denervation change (arrow). Opposed-phase T2 Dixon map (d) shows marrow involvement by OM. DWI images (e,f) show marrow replacement by OM on low (a), high (b), and apparent diffusion coefficient (ADC) maps (g,h). Quantification of the marrow abnormality by ADC (h) measures 1.49 compared to normal marrow of 0.21, indicating no intra-osseous abscess, which would appear dark on ADC and bright on DWI. (i) Contrast-enhanced MR shows enhancement of the metatarsal stump.

