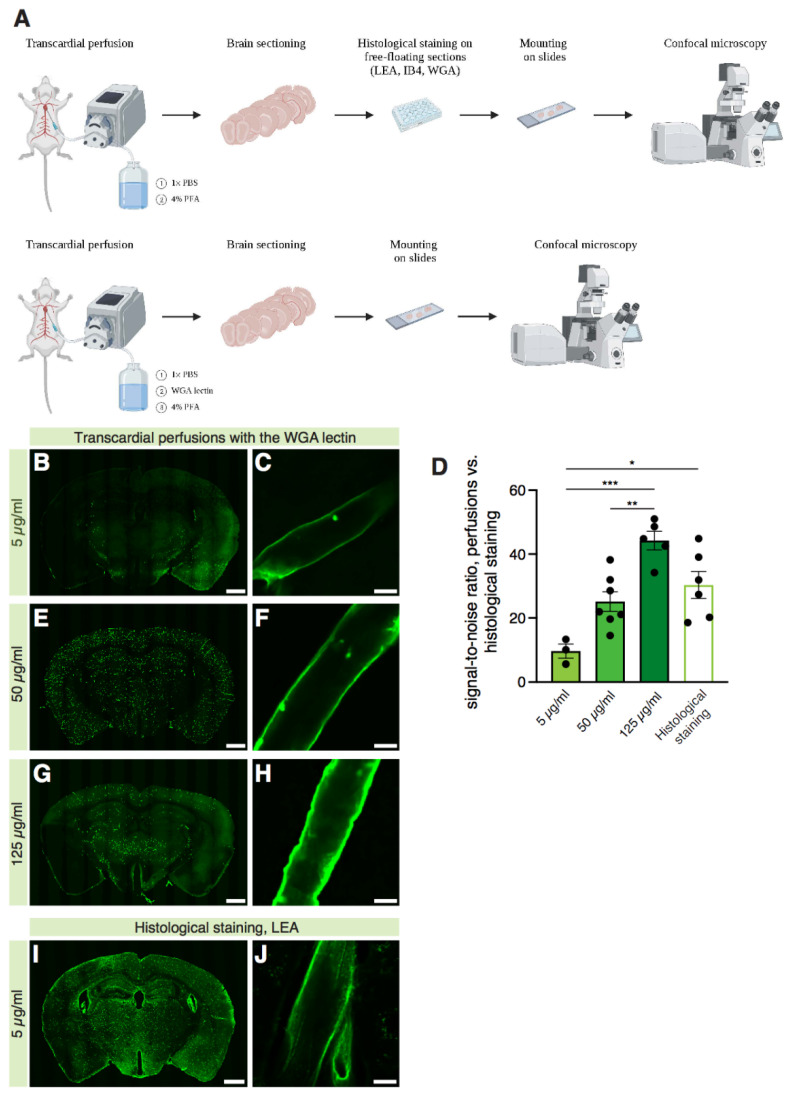
Figure 2.
Comparison of different methods to labeling brain vessels with lectins: intravascular WGA delivery during terminal perfusion vs. LEA histological staining on free-floating sections. (A) Schematic drawing summarizing the setup for the experiments comparing the two methods. Created with BioRender. (B–J) Representative 10× confocal images of brain sections of the mice intracardially perfused with the WGA lectin at a concentration of 5 µg/mL (B), 50 µg/mL (E), and 125 µg/mL (G) compared to the ones histologically stained with the LEA lectin (I) and (D) quantification of the signal-to-noise ratio of the vessels stained with different methods (representative confocal 20×-magnified images in C,F,H,J). Three vessels analyzed per animal; n = 3 mice for the 5 µg/mL group, n = 7 mice for the 50 µg/mL group, n = 5 mice for the 125 µg/mL group, n = 6 mice for the LEA histological staining group (one-way ANOVA test, p = 0.0002; Tukey’s multiple comparisons test: 5 µg/mL WGA vs. 125 µg/mL WGA, p = 0.0001; 5 µg/mL WGA vs. LEA, p = 0.0112; 50 µg/mL WGA vs. 125 µg/mL WGA, p = 0.0047). * = p < 0.05; ** = p < 0.01; *** = p < 0.001. Scale bars: 1000 µm for low-magnification images, 10 µm for high-magnification images.

