Figure 1.
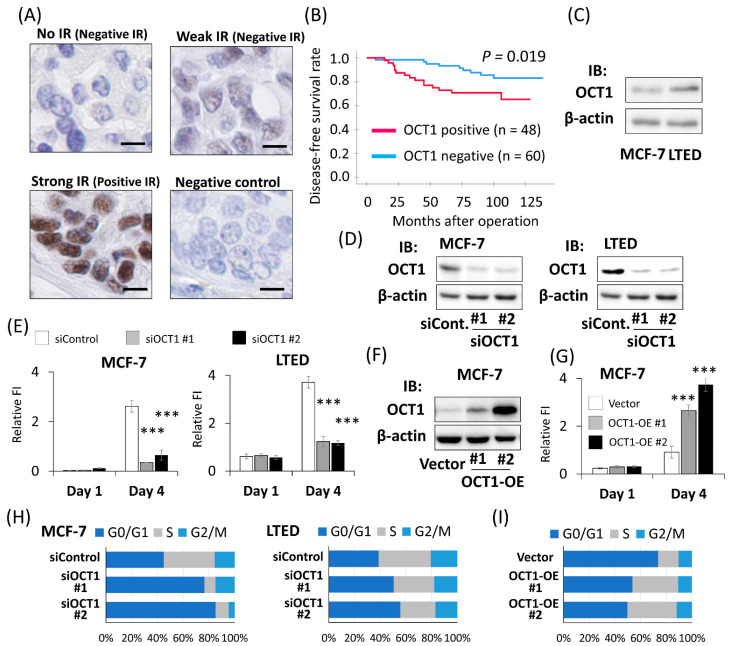
OCT1 was a poor prognostic factor in ER-positive breast cancer patients. (A) Representative micrographs of breast cancer tissues stained with OCT1 antibody. Strong immunoreactivity (IR) was defined as positive IR, whereas weak IR or no IR was defined as negative IR. A breast cancer tissue was applied to non-specific rabbit IgG antibody as a negative control. The scale bars represent 10 μm. (B) Disease-free survival of breast cancer patients with positive or negative OCT1 IR is shown by the Kaplan-Meier method. p-value was determined by the log-rank test. The red line represents cases with positive OCT1 IR (n = 48), and the blue line represents negative OCT1 IR (n = 60). (C) Western blot analysis for OCT1 expression in MCF-7 cells and LTED cells. β-actin protein was blotted as a loading control. IB, immunoblot. (D) Western blot analysis for OCT1 expression in MCF-7 cells and LTED cells treated with two kinds of siRNAs for OCT1 (siOCT1 #1 or #2) or siControl (siCont.). β-actin protein was blotted as a loading control. (E) DNA content of MCF-7 and LTED cells on indicated days after transfection of indicated siRNAs analyzed by Hoechst 33342 staining. Relative fluorescence intensity (FI) was shown as mean and SEM (n = 4). *** p < 0.001 compared to cells treated with siControl. (F) Western blot analysis for OCT1 expression in two clones of MCF-7 cells stably expressing OCT1 (OCT1-OE #1 and #2) and an MCF-7 clone transfected with empty vector (Vector). β-actin protein was blotted as a loading control. (G) DNA content of the OCT1-OE clones (#1 and #2) and the vector clone (Vector) on indicated days after seeding was analyzed by Hoechst 33342 staining. Relative fluorescence intensity (FI) was shown as mean and SEM (n = 4). *** p < 0.001 compared to the vector clone. (H) Proportions of cell populations in G0/G1, S, and G2/M phases of the cell cycle in MCF-7 and LTED cells transfected with indicated siRNAs. The results of flow cytometric analysis shown in Figure S4B were quantified. (I) Proportions of cell populations in G0/G1, S, and G2/M phases of the cell cycle in the OCT1-OE clones (#1 and #2) and the vector clone (Vector). The results of flow cytometric analysis shown in Figure S4C were quantified.

