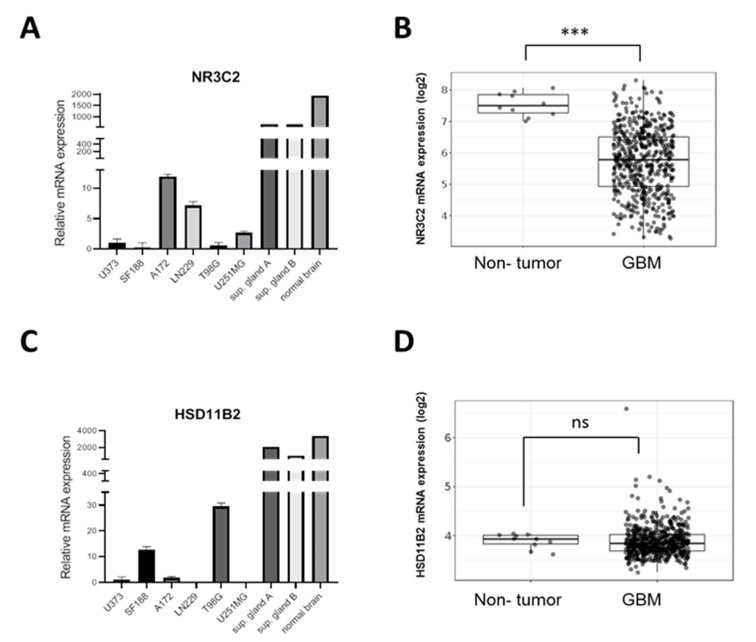
Figure 1.
NR3C2 and HSD11B2 expression in GBM (A) qRT-PCR analysis for NR3C2 in the indicated cell lines represented as mean fold change of triplicates. (B) NR3C2 (MR) mRNA expression levels in non-tumor (n = 10) and GBM (n = 528) samples in the TCGA GBM cohort. (C) qRT-PCR analysis for HSD11B2 in the indicated cell lines represented as mean fold change of triplicates (D) HSD11B2 mRNA expression levels in non-tumor and GBM samples in the TCGA cohort. In (B,D) Tukey’s Honest Significant Difference test was applied (n.s. = not significant, *** p < 0.001).

