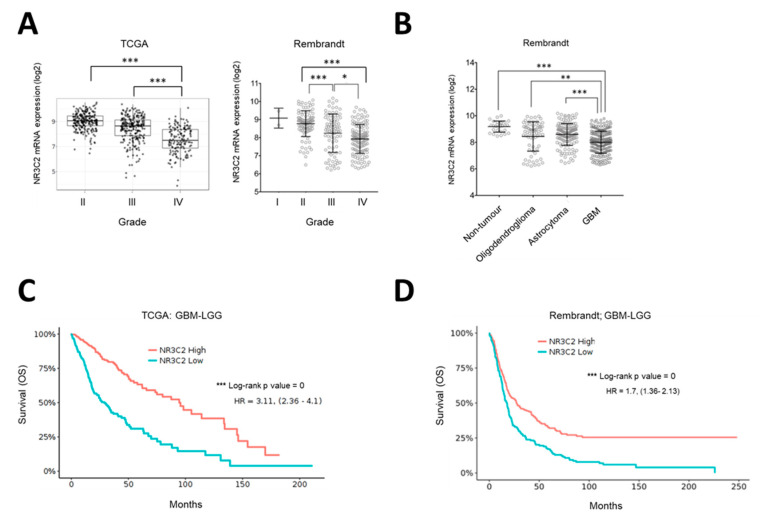
Figure 2.
NR3C2 expression in glioma grades and clinical outcome (A) NR3C2 mRNA expression in TCGA and Rembrandt Glioblastoma datasets in different grades. (B) NR3C2 mRNA expression in low grade glioma subtypes (LGG) and GBM. (C) Kaplan-Meier analysis of the GBM-LGG TCGA patient cohort. Differences in overall survival for patients with high (n = 333) or low (n = 334) expression of NR3C2 are shown. Hazard ratio and p (log-rank) are indicated. (D) Kaplan-Meier analysis of GBM-LGG Rembrandt patient cohort. Differences in overall survival for patients with high (n = 201) or low (n= 196) expression of NR3C2 are shown. Hazard ratio and p (log-rank) are indicated. * p < 0.05, ** p < 0.01, *** p < 0.001. Datasets were obtained and analyzed using the GlioVis data portal [16].

