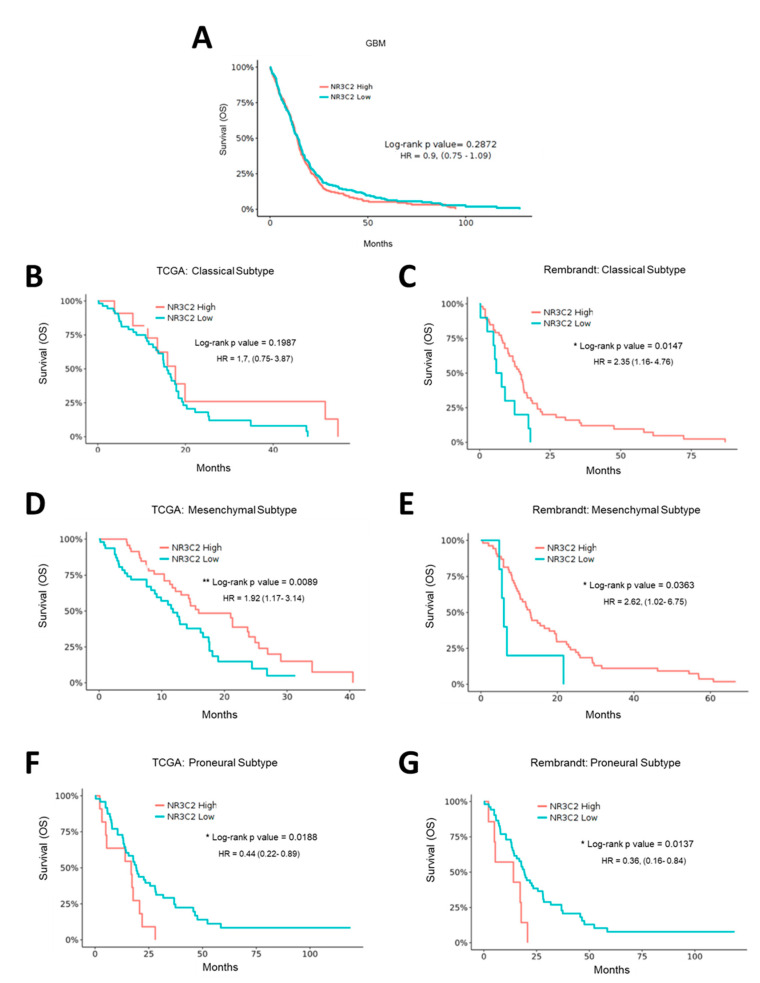
Figure 3.
NR3C2 expression and clinical outcome in GBM subtypes. Kaplan-Meier analysis of (A) GBM TCGA patient cohort. Differences in overall survival for patients with high (n = 263) or low (n = 262) expression of NR3C2 are shown. (B) TCGA Classical subtype patient cohort. Differences in overall survival for patients with high (n = 14) or low (n = 55) expression of NR3C2 are shown. (C) Rembrandt Classical subtype patient cohort. Differences in overall survival for patients with high (n = 53) or low (n = 10) expression of NR3C2 are shown (D) TCGA Mesenchymal subtype patient cohort. Differences in overall survival for patients with high (n = 49) or low (n = 49) expression of NR3C2 are shown (E) Rembrandt Mesenchymal subtype patient cohort. Differences in overall survival for patients with high (n = 54) or low (n = 5) expression of NR3C2 are shown (F) TCGA Proneural subtype patient cohort. Differences in overall survival for patients with high (n = 11) or low (n = 48) expression of NR3C2 are shown (G) Rembrandt Proneural subtype patient cohort. Differences in overall survival for patients with high (n = 7) or low (n = 52) expression of NR3C2 are shown Hazard ratio and p (log-rank) are indicated. * p < 0.05, ** p < 0.01. Datasets were obtained and analyzed using the GlioVis data portal [16].

