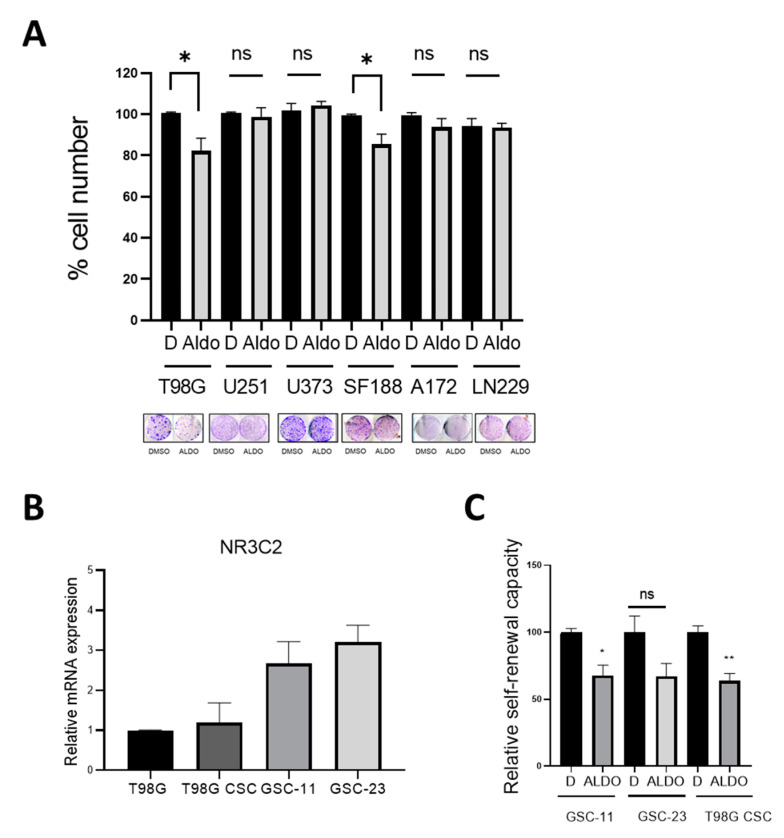
Figure 4.
Effect of Aldosterone on glioma cell lines and glioma stem cells (A) Quantification of cell numbers in the indicated cell lines in the absence or presence of aldosterone (Aldo) 10−6 M. Data represent the mean ± SEM (n ≥ 3). A colony formation assay is shown as example. (B) qRT-PCR analysis for NR3C2 in T98G cells, T98G cells grown as neurospheres and GSC-11 and GSC-23 patient derived glioma stem cell lines. Data represented as mean fold change of triplicates. (C) Quantification of sphere formation by CSCs cultured in stem cell medium under non-adherent conditions in the absence or presence of ALDO 10−6M Data represent the mean ± SEM (n ≥ 3). * p < 0.05, ** p < 0.01, n.s. = not significant.

