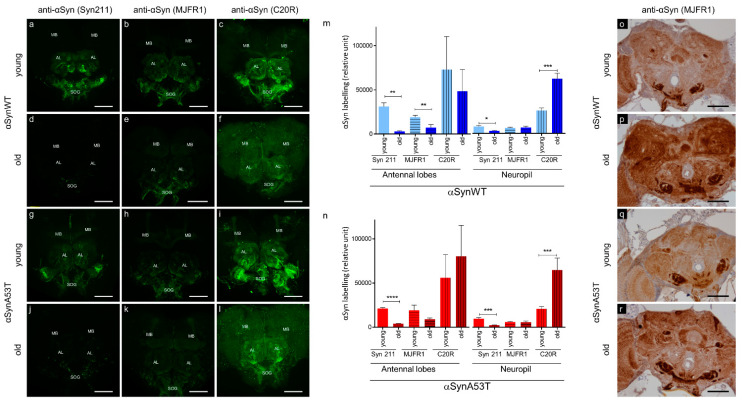
Figure 1.
αSyn transgenic flies show an age-dependent αSyn epitope-masking. Representative immunofluorescence or immunohistochemistry brain images of young (5-day-old for immunofluorescence or 10-day-old for immunohistochemistry) (a–c,g–i,o,q) or old (60-day-old) (d–f,j–l,p,r) flies expressing human αsynWT (a–f,o,p) or αsynA53T (g–l,q,r) under the ELAV driver. Flies were raised on standard corn meal food supplemented with yeast. For immunofluorescence images, αSyn was stained (indicated in green) with different αSyn-specific antibodies: Syn 211 (a,d,g,j), MJFR1 (b,e,h,k) or C20R (c,f,i,l) on dissected fly brains of young and old flies. Images were projected from confocal Z-stacks acquired on confocal microscope using MAX intensity method. Note a prominent staining of the αSyn in the mushroom bodies (MB), cell bodies of the antennal lobes (AL) and suboesophageal ganglions (SOG). Quantifications of fluorescence were determined after z-projection (using SUM intensity method) on selected regions of interest (antennal lobes or in neuropils of the anterior ventrolateral protocerebrum) for flies expressing human αsynWT (m) or αsynA53T (n). Data are shown as mean with standard deviation for the three different αSyn-specific antibodies for young or old flies from two independent experiments: Syn211 (n = 5 for αsynWT and n = 6 for αsynA53T in antennal lobes; n = 5 for αsynWT and n = 6 for αsynA53T in neuropil), MJFR1 (n = 6 for αsynWT and n = 6 for αsynA53T in antennal lobes; n = 7 for αsynWT and n = 6 for αsynA53T in neuropil) and C20R (n = 7 for αsynWT and n = 9 for αsynA53T in antennal lobes; n = 7 for αsynWT and n = 8 for αsynA53T in neuropil). p-values of the group differences were calculated using t-test (** p = 0.0026 (αsynWT, antennal lobes, Syn211), ** p = 0.0070 (αsynWT, antennal lobes, MJFR1), **** p < 0.0001 (αsynA53T, antennal lobes, Syn211), * p = 0.0138 (αsynWT, neuropil, Syn211), *** p = 0.0002 (αsynWT, neuropil, C20R), *** p = 0.0009 (αsynA53T, neuropil, Syn211) and *** p = 0.0006 (αsynA53T, neuropil, C20R), respectively). Immunohistochemistry was performed using MJFR1 antibody (o–r) with antigenic unmasking protocol and revealed an accumulation of αSyn in older flies. Scale bar, 30 µm.

