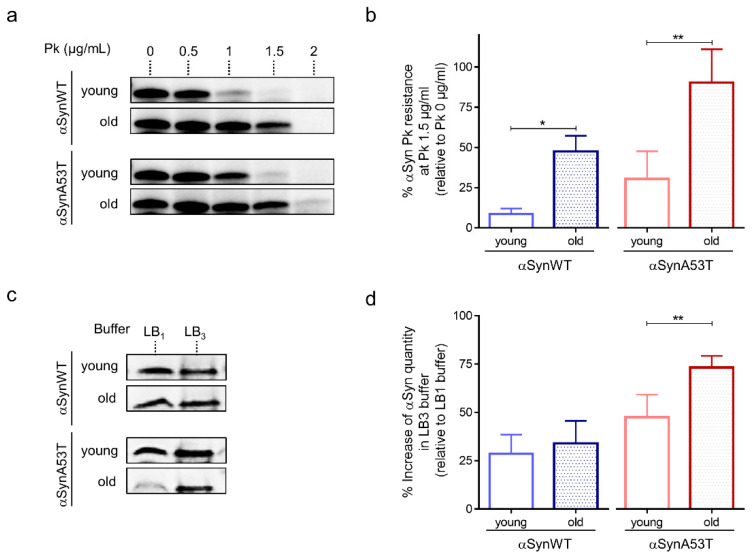
Figure 2.
Age-dependent biochemical profile of αSyn protein in αSyn-expressing flies. (a) Proteinase-K (PK) resistance assay of αSyn performed on protein extracts from heads of αSynWT and αSynA53T expressing flies analyzed by Western blot with the anti-αSyn MJFR1 antibody. The lanes show increasing concentration of PK (from 0 to 2 µg/mL) for young (1-day-old) or old (40-day-old) flies. (b) The graph shows the percentage of protein remaining after digestion with 1.5 µg/mL PK concentration (relative to the undigested sample) in young (before 20-day-old) or old (at least 40-day-old) for αSynWT and αSynA53T expressing flies. Western blot signals were measured by densitometry using the software Image lab version 5.2.1 build 11. Quantifications showed a significant increase in αSyn PK resistance between young flies and old flies for αSynWT (n = 4) and αSynA53T (n = 7). Data are shown as means ± standard deviations. p-values of the group differences were calculated using t-test (* p = 0.0335 and ** p = 0.0086, respectively). (c) Soluble αSyn protein detection after extraction with denaturating buffers of increasing strength (LB1 < LB3). Western blot assessment (with the MJFR1 antibody) of αSyn protein in the soluble fraction of LB1 0.5% NP40 and LB3 urea/thiourea lysis buffers on young (1-day-old) or old (40-day-old) flies expressing αSynWT or αSynA53T. (d) The graph shows the percentage of protein quantity in LB3 relative to LB1 for young and old flies (n = 7 for αSynWT and n = 8 for αSynA53T). Data are shown as mean with standard deviation. p-values of the group differences were calculated using t-test (** p = 0.005). Flies were raised on standard corn meal food supplemented with yeast.

