Figure 3.
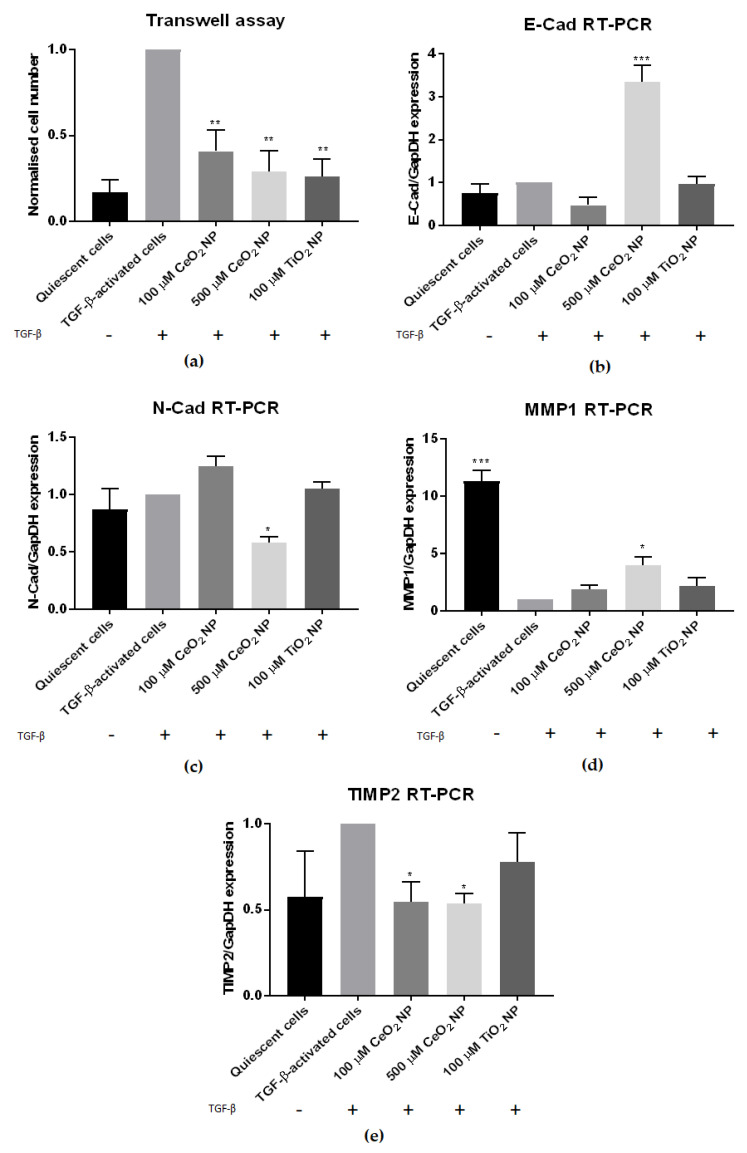
CeO2 NP-treated cells show reduced hepatic fibrosis hallmarks. (a) Transwell assay examining the cell motility of CeO2 NP-treated cells showed significantly reduced motility in 100 µM, 500 µM and TiO2-treated cells. (n = 3) (b) The 500 µM CeO2 NP-treated cells showed significantly elevated E-cad mRNA expression. (n = 3) (c) The 500 µM CeO2 NP-treated cells also had significantly reduced N-cad mRNA expression. (n = 3) (d) RT-PCR analysis showed significantly higher MMP1 expression in 500 µM CeO2 NP-treated cells. (n = 3) (e) TIMP2 mRNA expression was significantly downregulated in 100 µM CeO2 NP and 500 µM CeO2 NP-treated cells. (n = 4). Error bars represent SEM; ANOVA was used to calculate significance. * p < 0.05, ** p < 0.01, *** p < 0.001.

