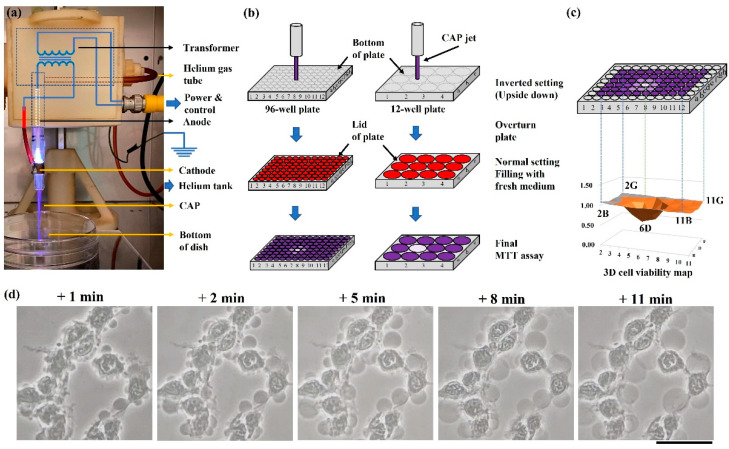
Figure 8.
The CAP jet source and physically based treatment: (a) The CAP jet source; (b) basic strategies to perform a physically based treatment on 96-well or 12-well plates; (c) 3D cell viability map. The 3D map presents all middle 10 × 6 wells’ relative cell viabilities in one figure. Five marked well numbers represent the boundary wells and the CAP-treated well “6D”. (d) A time-lapse imaging of a typical cellular change over the initial 11 min after a 2 min of treatment. Photos were taken at 1, 2, 5, 8, and 11 min after treatment, using a Nikon TS100 inverted phase-contrast microscope. Scale bar = 50 μm.

