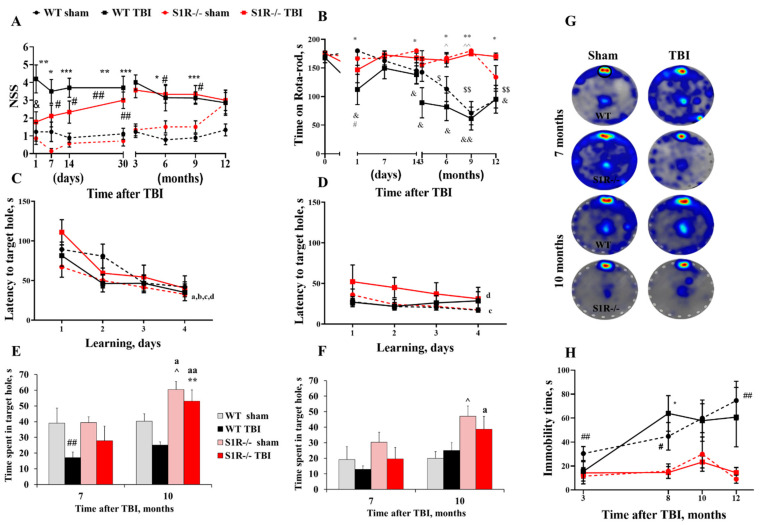
Figure 1.
Long-term behavioral changes after traumatic brain injury (TBI). Behavioral testing revealed functional deficits in the (A) neurological severity score (NSS), (B) rota-rod (RR), (C–G) Barnes maze (BM), and (H) tail suspension tests. (A) Wild-type (WT) TBI mice showed neurological deficits compared to WT sham mice 24 h after injury. WT sham n = 9, WT TBI n = 7–10, Sigma-1 receptor knockout (S1R-/-) sham n = 6–8, S1R-/- TBI n = 6–9. * p < 0.05 WT TBI vs. S1R-/- TBI, # p < 0.05, ## p < 0.01 sham vs. TBI (the black symbols represent differences between WT groups, and the red symbols represent differences between S1R-/- groups). (B) WT TBI mice spent less time on the RR than WT sham mice 24 h after injury. Motor coordination was impaired in the WT TBI group at all time points after injury compared to baseline values. Motor coordination remained unaffected in S1R-/- mice after TBI. WT sham n = 8, WT TBI n = 6–9, S1R-/- sham n = 7, S1R-/- TBI n = 6–9. * p < 0.05, ** p < 0.01, *** p < 0.001 WT TBI vs. S1R-/- TBI, ^ p < 0.05, ^^ p < 0.01 WT sham vs. S1R-/- sham, ## p < 0.01 WT sham vs. WT TBI, $ p < 0.05, $$ p < 0.01 WT sham vs. baseline, & p < 0.05, && p < 0.01 WT TBI vs. baseline. In terms of BM performance, (C) all groups showed a reduced latency to find the target hole, indicating no impairments in the learning task (C) 7 and (D) 10 months after injury. (E) During the short-term memory evaluation, WT TBI animals spent significantly less time in the target hole than WT sham animals at 7 months postinjury. ** p < 0.01 WT TBI vs. S1R-/- TBI ##, ^ p < 0.05 WT sham vs. S1R-/- sham, ## p < 0.01 WT sham vs. WT TBI, a p < 0.05, aa p < 0.01 7 vs. 10 months. (F) TBI did not induce long-term memory impairments at 7 and 10 months after the injury. WT sham n = 9, WT TBI n = 10, S1R-/- sham n = 7, S1R-/- TBI n = 9. ^ p < 0.05 WT sham vs. S1R-/- sham, a p < 0.05 7 vs. 10 months. (G) Heat maps representing weighted occupancy across probe trials conducted 7 and 10 months after TBI. Warmer colors indicate longer dwelling times. The target hole area is denoted with a black circle. (H) WT sham and TBI mice showed a time-dependent increase in immobility time after injury. WT sham n = 8–9, WT TBI n = 6–9, S1R-/- sham n = 5–8, S1R-/- TBI n = 7–8. * p < 0.05 WT TBI vs. S1R-/- TBI, ^ p < 0.05, ^^ p < 0.01 WT sham vs. S1R-/- sham. All values are presented as means ± standard errors of the means (SEM). p values for differences between groups were calculated using repeated measures two-way analysis of variance (RM two-way ANOVA) followed by Fisher’s least-significant difference (LSD) test.

