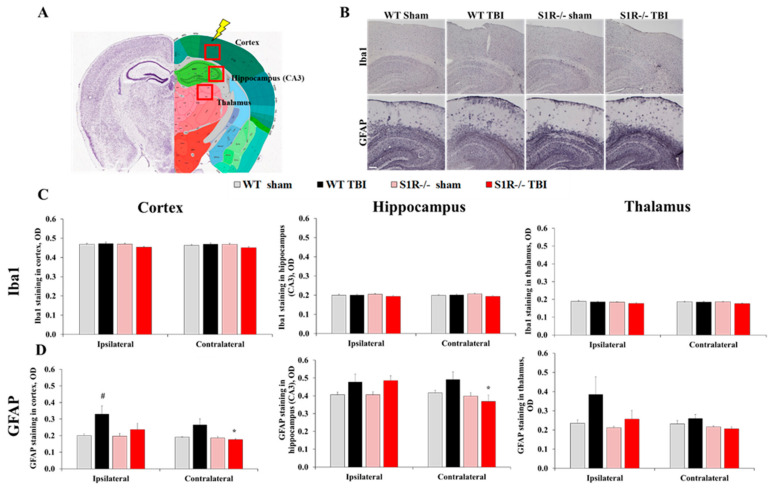
Figure 2.
Staining of microglia (Iba1) and astrocytes (GFAP) in WT and S1R-/- mouse brain slices at 12 months postinjury. (A) The anatomical positions of the analyzed brain regions were validated using the Allen Mouse Brain Atlas (http://mouse.brain-map.org/static/atlas, accessed on 15 October 2021). (B) Representative images of Iba1 and GFAP staining in the cortex and hippocampus (total magnification = 40×, scale bar = 100 µm). Measured optical densities (OD) of the staining intensity of (C) Iba1 and (D) GFAP in the cortex, hippocampus, and thalamus between the WT and S1R-/- animal groups. All values are presented as the means ± SEM. p values for differences between groups were calculated using the Mann–Whitney U-test, (n = 5): * p < 0.05 WT vs. S1R-/-, # p < 0.05 WT sham vs. WT TBI.

