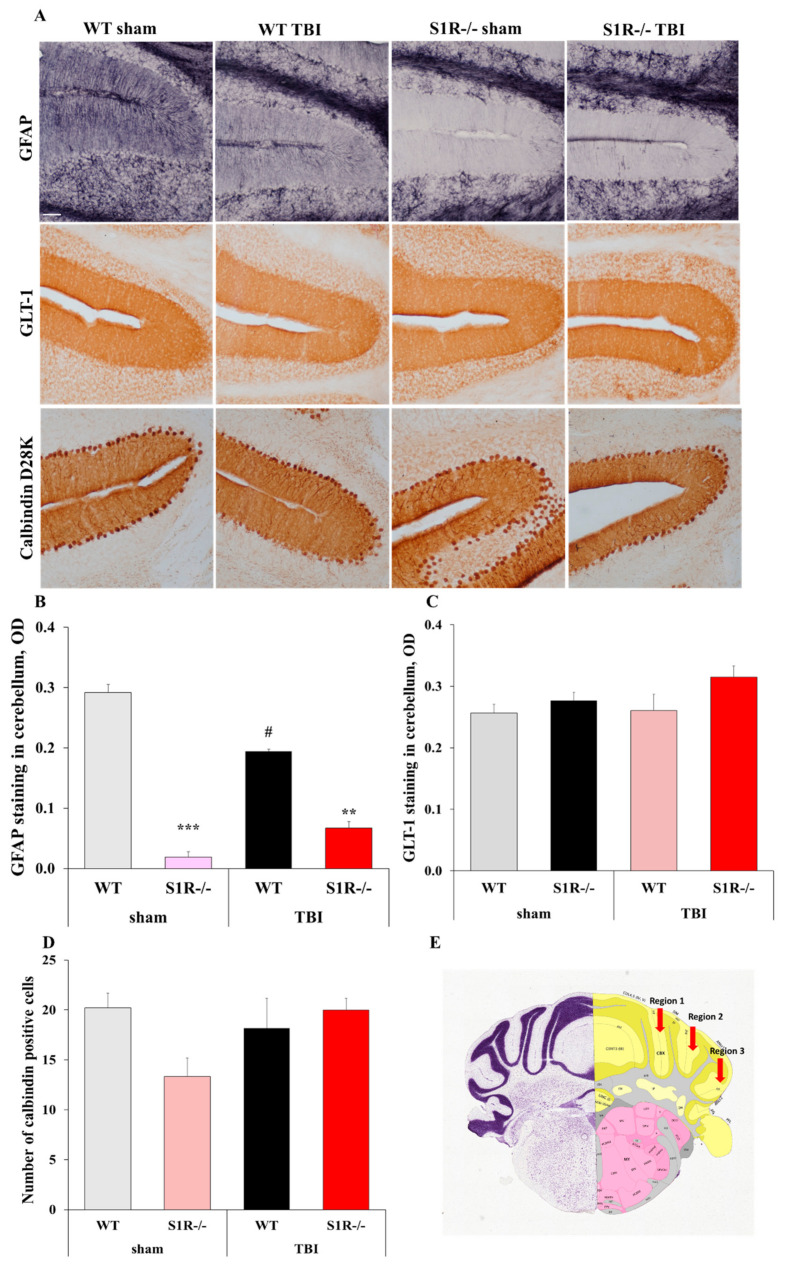
Figure 3.
Staining of astrocytes (GFAP, Glt-1) and Purkinje cells (Calbindin D28K) in WT and S1R-/- mouse cerebellum slices at 12 months postinjury. (A) Representative images of GFAP, Glt-1, and Calbindin D28K staining in the grey matter of the cerebellum (total magnification = 100×, scale bar = 50 µm). OD of the GFAP (B), Glt-1 (C) staining intensity in the molecular layer of the cerebellum between the WT and S1R-/- experimental groups. (D) Total cell counts of Purkinje cells in the molecular layer of the cerebellum between WT and S1R-/- experimental groups. (E) Anatomical positions of the analyzed regions in the cerebellum (red arrows). All values are presented as the means ±SEM. p values for differences between groups were calculated using the Mann–Whitney U-test, (n = 5): ** p < 0.01, *** p < 0.001 WT vs. S1R-/-, # p < 0.05 WT sham vs. WT TBI.

