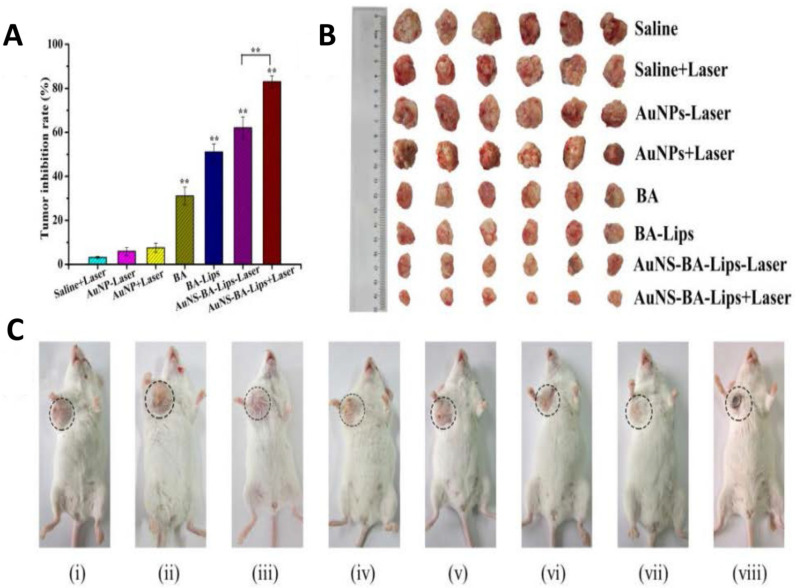
Figure 4.
(A) The tumor inhibition rates. (B) Photographs of tumors after 14 days of treatment. (C) Representative photographs of tumor-bearing mice after 14 days of treatment. (i) saline, (ii) saline + Laser, (iii) AuNP-Laser, (iv) AuNP + Laser, (v) BA, (vi) BA-Lips, (vii) AuNS-BALips-Laser, (viii) AuNS-BA-Lips + Laser. The tumor was marked with dashed circles. ** p < 0.01. Reproduced from ref. [233] with permission from Elsevier. Copyright (2017) Nanomedicine.

