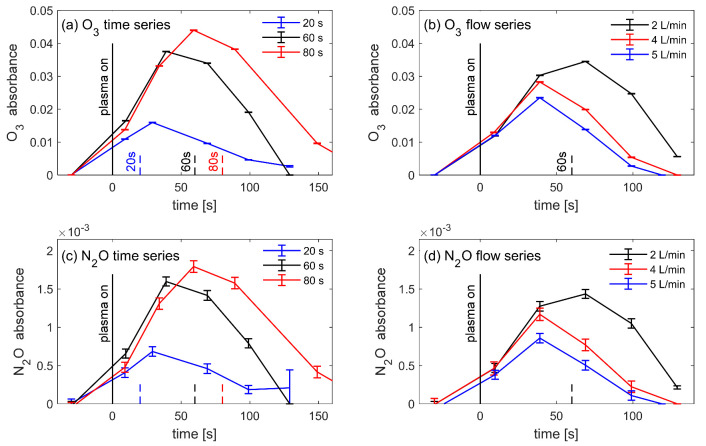
Figure 3.
Time-dependent absorbance measurements of O3 and N2O from the series of treatment times (20, 60, and 80 s plasma duration) and flow rate (2, 4, and 5 L/min). The densities of both molecules increase with the plasma treatment time, and decrease with the air flow rate, as expected. The O3 and N2O molecules follow similar trends for each series. The measurements for the default parameters are shown in black.

