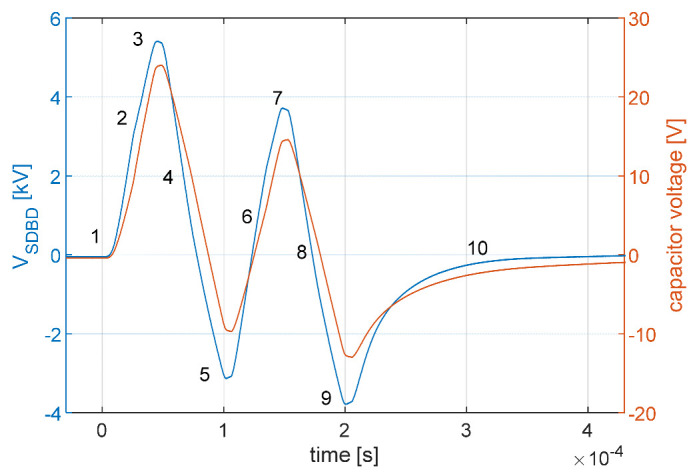
Figure 5.

The voltage waveform of the SDBD plasma-seed treatment for nominal 8 kV peak-to-peak. The blue curve shows the voltage measured across the SDBD; the orange curve shows the voltage across the 68 nF series capacitor used to measure the charge on the electrode. The waveform distortion is caused by the transient response of the high-voltage amplifier when using high-frequency bursts. The numbers are used as references for Figure 6 to highlight specific key points.
