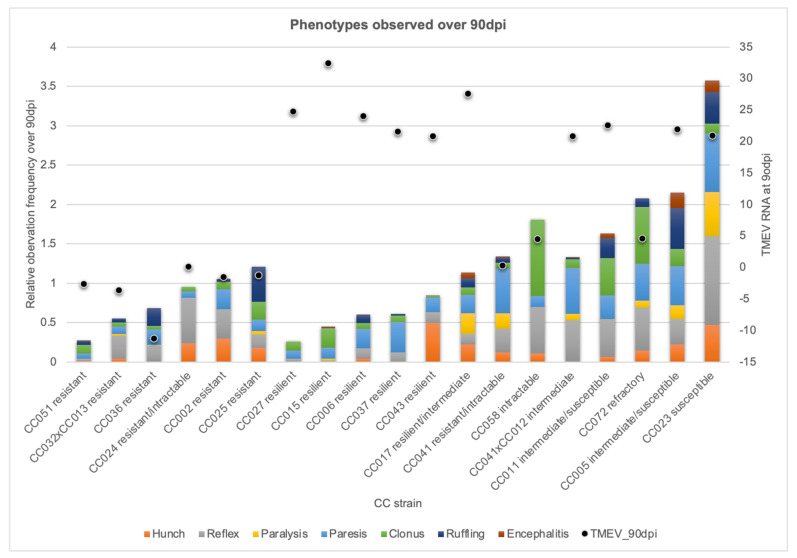
Figure 2.
Full 90 dpi cumulative phenotype profiles for each strain are shown with each of the 7 phenotype categories distinguished by color. Strains are ordered from left to right by response category. “Relative observation frequency over 90 dpi” shows the cumulative frequencies of hunching, delayed righting reflex, paresis, paralysis, clonus, ruffling, and encephalitis observed over 90 dpi, as described previously [23]. “TMEV RNA at 90 dpi” shows levels of TMEV RNA measured at 90 dpi (log2FoldChange values) as dots.

