Figure 4.
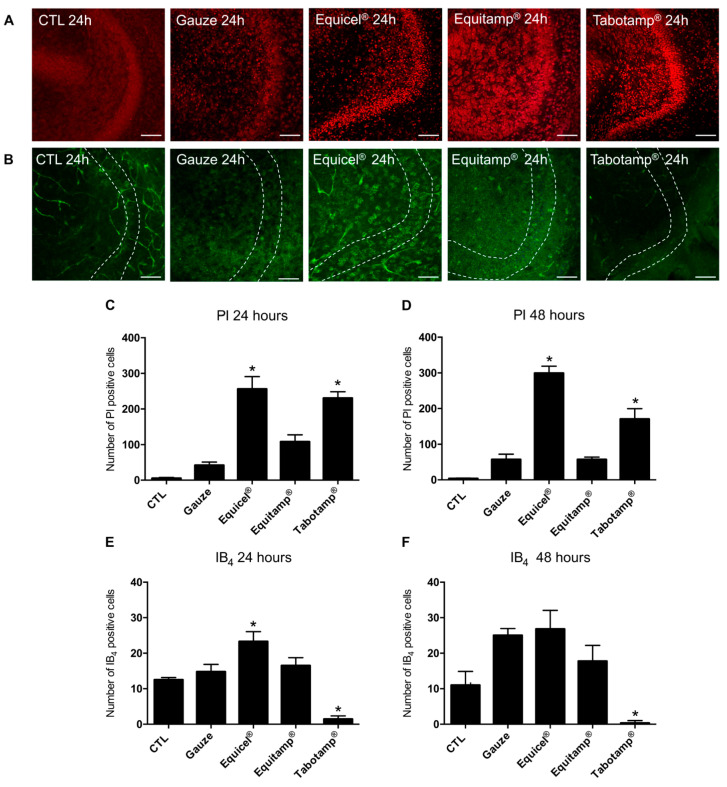
Effects of treatment with Equicel®, Equitamp® and Tabotamp® on cell viability and microglia activation in OHSC after 24 and 48 h. PI staining (red) of OHSC as recorded by confocal laser scanning microscopy representing dentate gyrus (DG) with granule cells (24 h results displayed) (A). Treatment with Equicel® and Tabotamp® led to intense red stained PI positive nuclei in DG regions. Equitamp® caused a mild accumulation of PI in the cells of the DG. IB4 staining (green) of OHSC recorded by confocal laser scanning microscopy representing microglia cells and remaining vessels. In CTL, only isolated ramified microglia cells were visible. Treatment with Equicel® led to increase of amoeboid microglia cells in the DG. Dotted lines mark the borders of GCL (B). Quantitative analysis of the number of PI positive degenerating cells in GCL (C,D). Equicel® (* p < 0.001) and Tabotamp® (* p < 0.01) induced a significant increase of PI positive cells in GCL 24 h after treatment compared gauze (C). Similar results were obtained for Equicel® (* p < 0.001) and Tabotamp® (* p < 0.01) compared to the OHSC treated with gauze after 48 h (D). Quantitative analysis of the number of IB4 positive microglia cells in GCL (E,F). After 24 h incubation with Equicel®, a significant increase in IB4 positive microglia in the DG compared to the gauze was observed (*, p < 0.05). A clearly reduced number of IB4 positive microglia was detected for Tabotamp® compared to gauze (* p < 0.001) (E). After 48 h no significant difference in IB4 positive microglia cells between Equicel® and gauze was detectable (F). A general increase in the number of microglia was found in treated groups compared to the results after 24 h (CTL compared to gauze: * p < 0.001 after 48 h). For Tabotamp®, a significant reduction of microglia was present after 48 h compared to gauze (* p < 0.001). For a statistical comparison of all groups, see Table S2. Bar = 100 µm.

