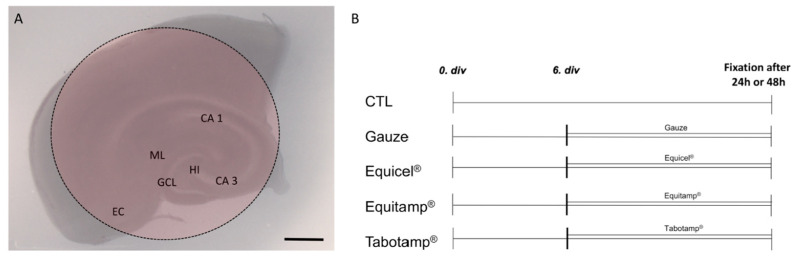
Figure 6.
Schematic representation of an OHSC with ORC and treatment protocol. Schematic visualization of OHSC in culture. Intact cytoarchitecture of the OHSC is demonstrated with the entorhinal cortex (EC), the hippocampus with cornu ammonis (CA) subfields CA 1 and CA 3, the hilus re-gion (HI) and the dentate gyrus with the molecular layer (ML) and the granule cell layer (GCL). The red area indicates the location of the ORC (A). Treatment protocol of the OHSC (B). Bar = 1 mm.

