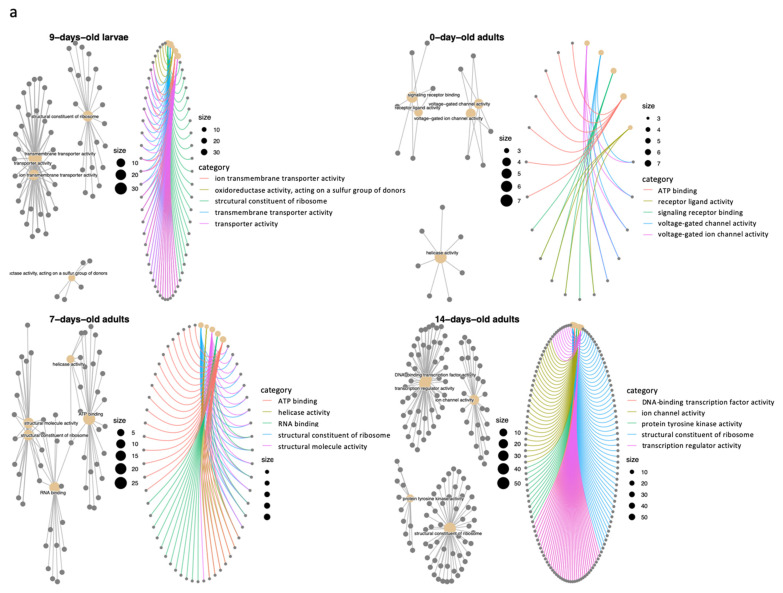
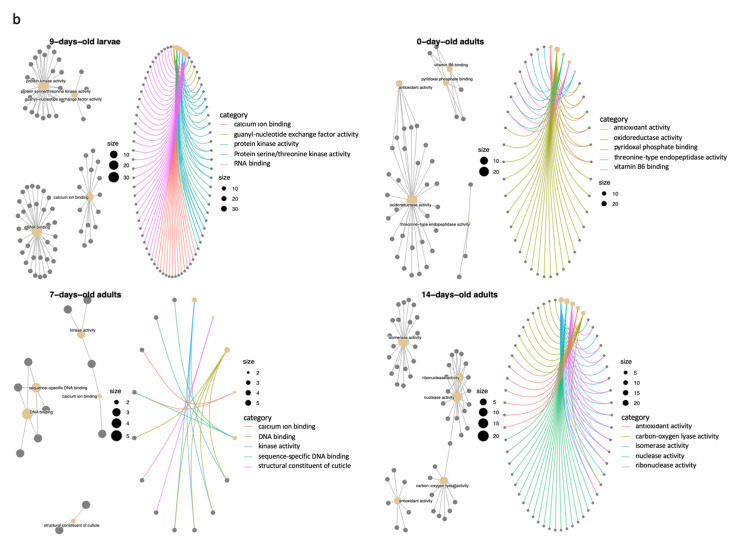
Figure 2.
Gene-pathway concept network for overrepresentation testing for GO terms in the pool of (a). upregulated and (b). downregulated DEGs among different imidacloprid treatments in 9-day-old larvae, 0-day-old adults, 7-day-old adults, and 14-day-old adults. Size: number of DEGs; category: the GO terms category. Gray lines indicate the network connection, and the weight of the line reflects the degree of connection between terms. Colored lines indicate the connection between terms and the involved genes. The concept network plot shows that the genes are involved in significant terms and biological complexness.


