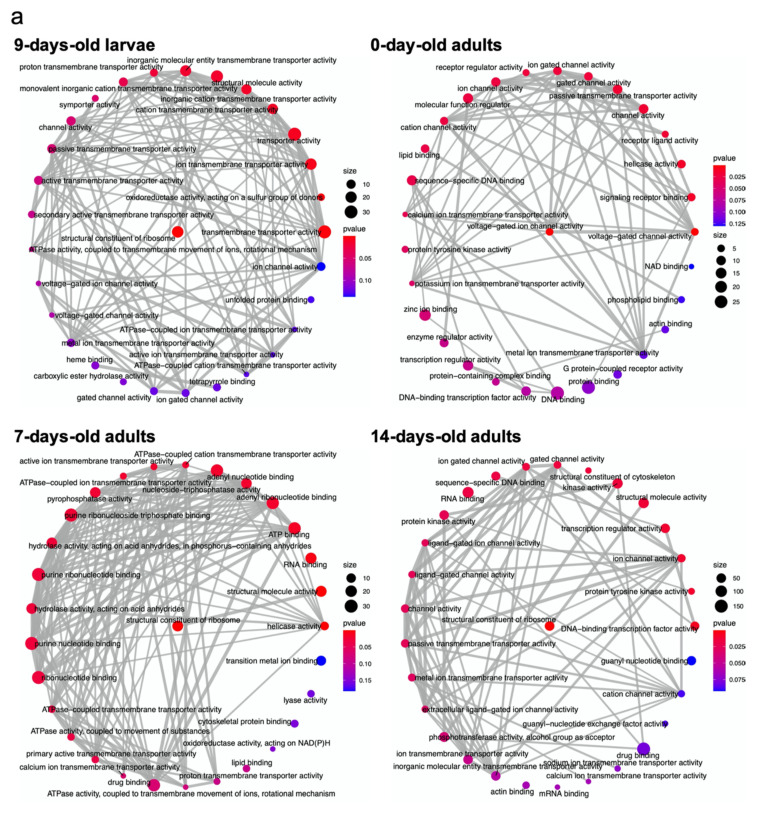
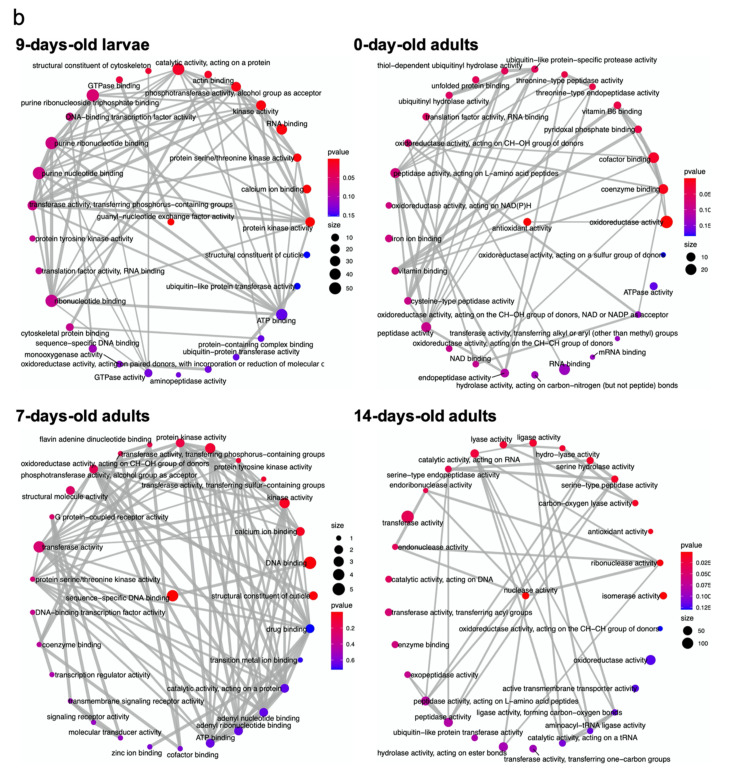
Figure 3.
Enrichment maps for overrepresentation testing for GO terms in the pool of (a) upregulated and (b) downregulated DEGs among different imidacloprid treatments in 9-day-old larvae, 0-day-old adults, 7-day-old adults, and 14-day-old adults. Size: number of DEGs; p value: the p value of identified GO terms. The color from red to blue represents the p value from low to high. Gray lines indicate the network connection, and the weight of the line reflects the degree of connection between terms.


