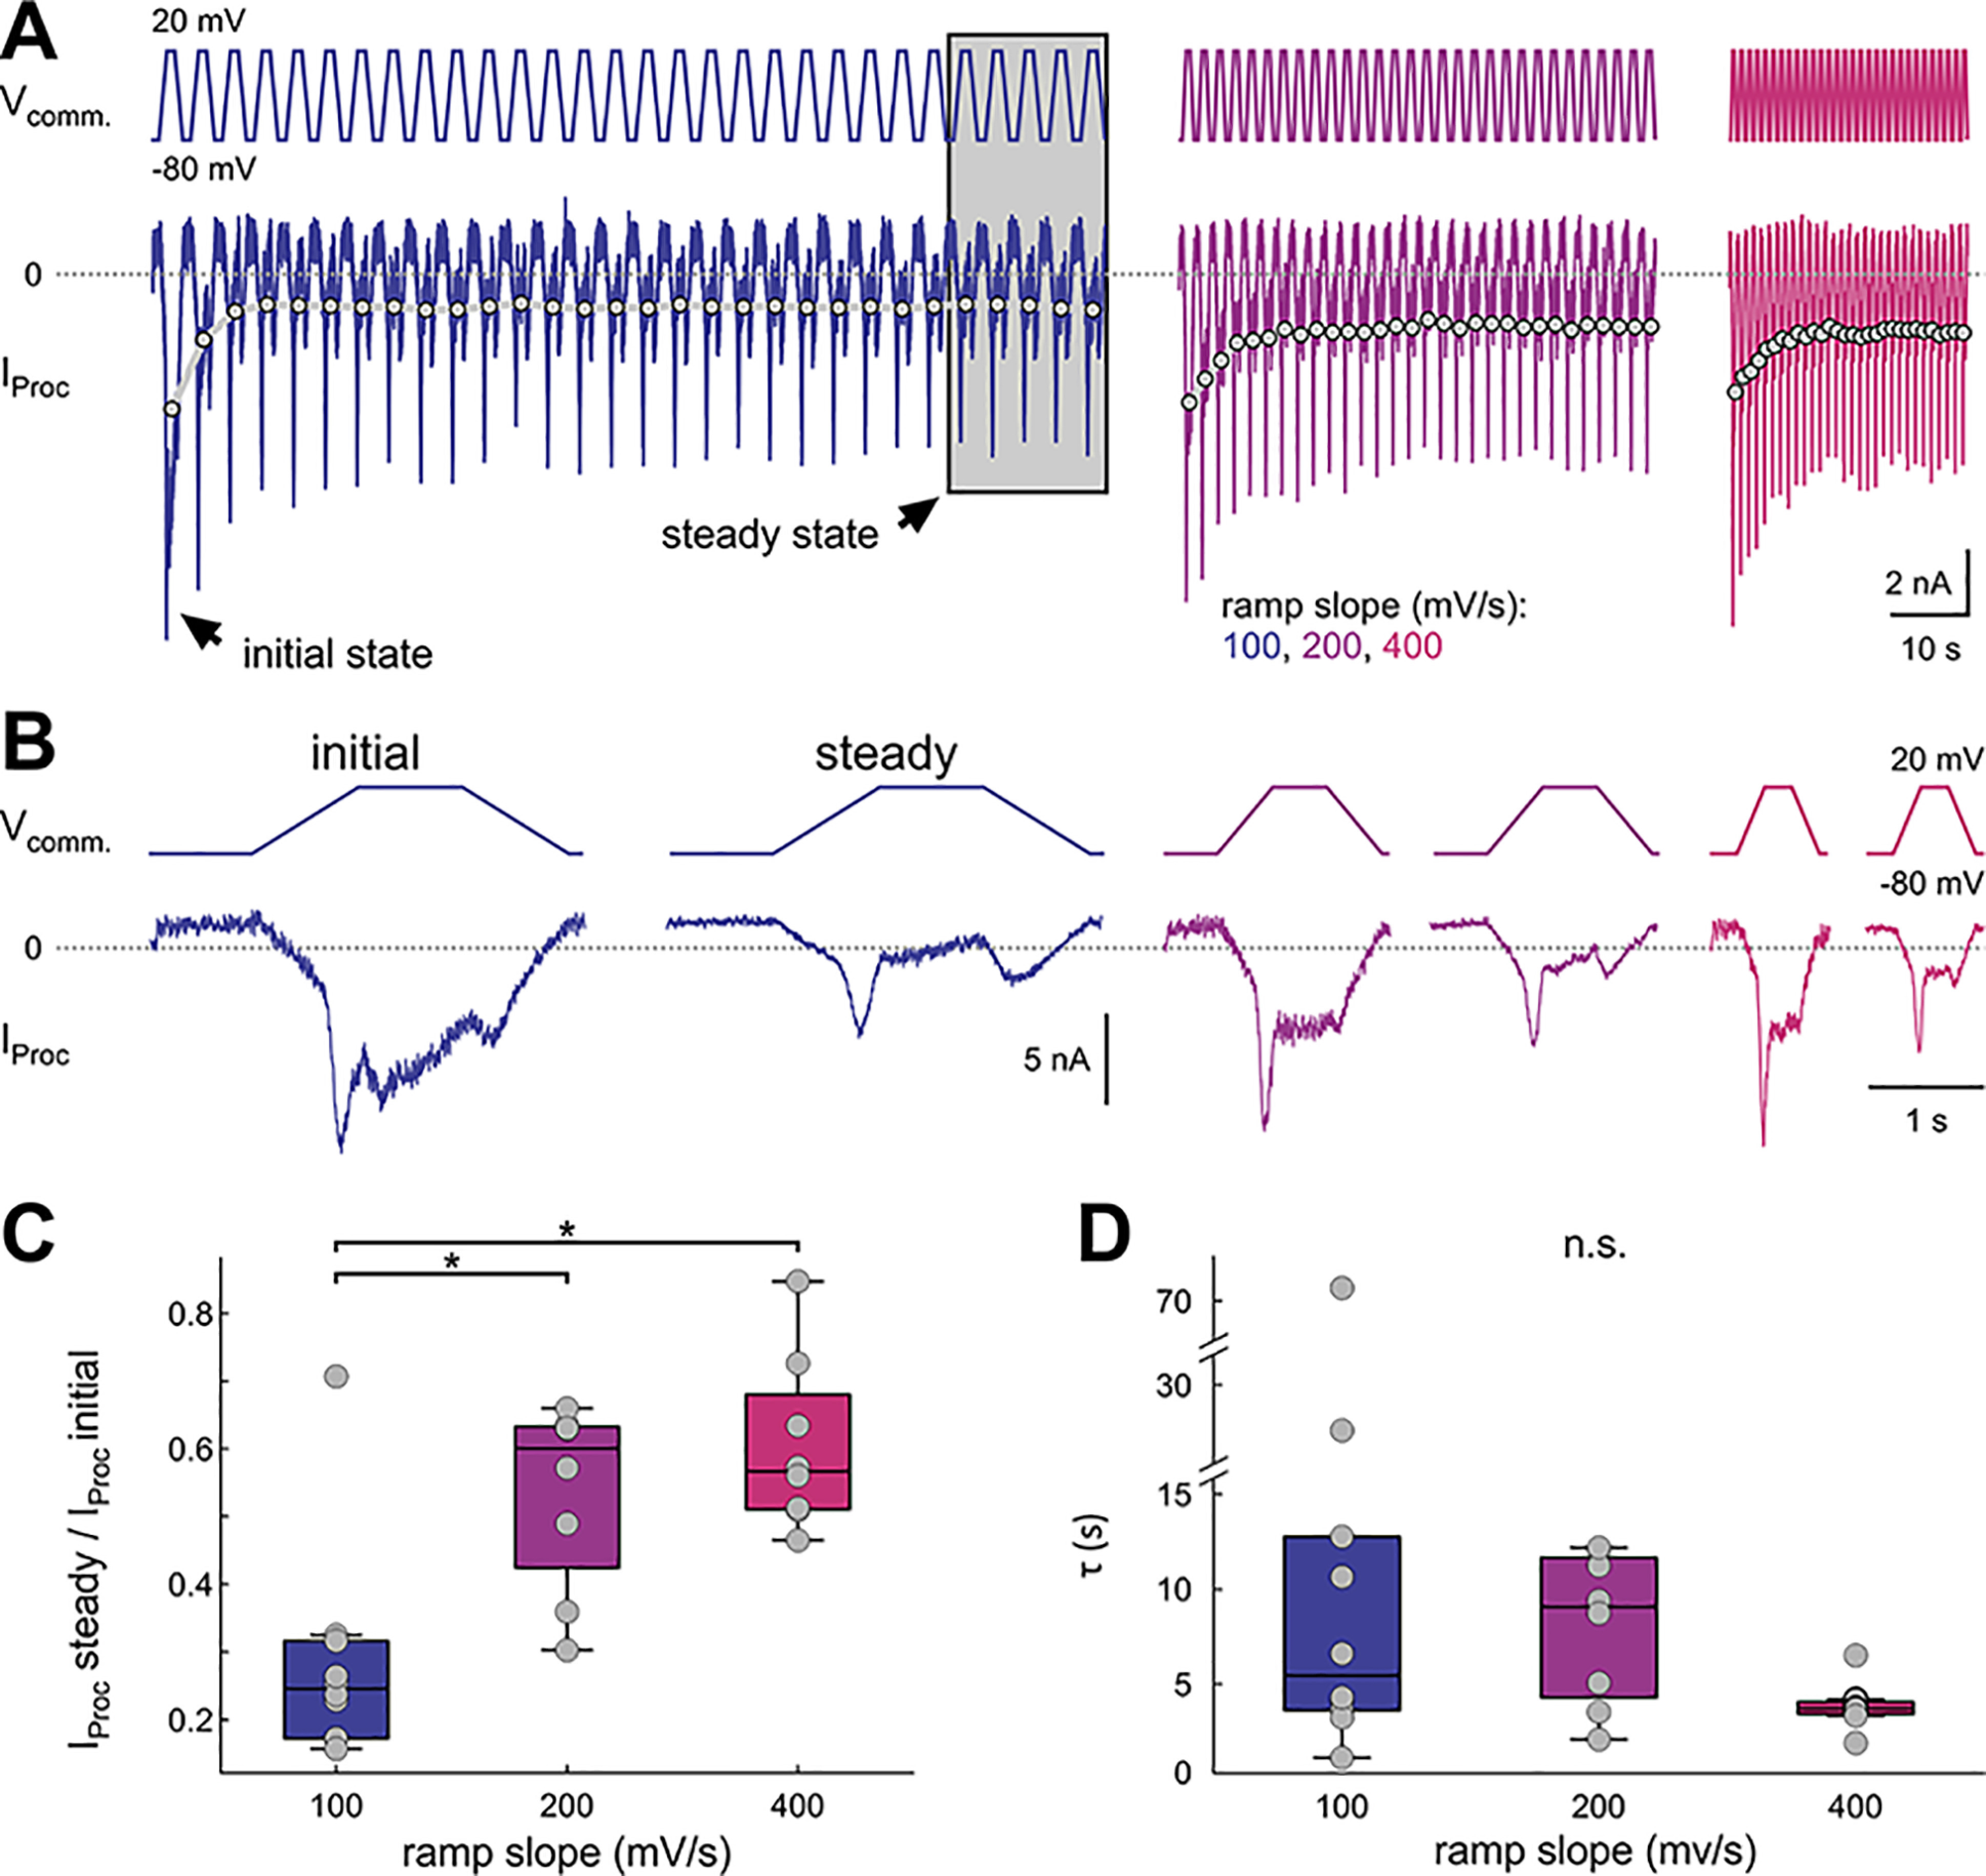
Figure 3.

Proctolin-activated currents show slow inactivation. A, Proctolin-activated currents (IProc) in response to 30 sweeps of ramp-and-hold stimuli with different slopes (color-coded). The gray dots connected by lines depict the average IProc for each sweep in this experiment. We refer to IProc during the first sweep as initial state, and to the average of the last five sweeps as steady state (gray box). B, First (initial state) and averaged last five (steady state) sweeps from the experiment in A. C, Ratio of IProc between steady state and initial state. The slow inactivation of IProc is greater at 100 mV/s ramps compared with 200 and 400 mV/s ramps (RM ANOVA; Table 1; results in Extended Data Fig. 3-1). Each dot represents an individual experiment. D, Time constants for slow inactivation. Each dot represents an individual experiment. Time constants were not significantly different between slopes (ANOVA on ranks; Table 1; results in Extended Data Fig. 3-2). Asterisks indicate significance at α = 0.05. n.s. indicates no significant changes.
