
Figure 6.
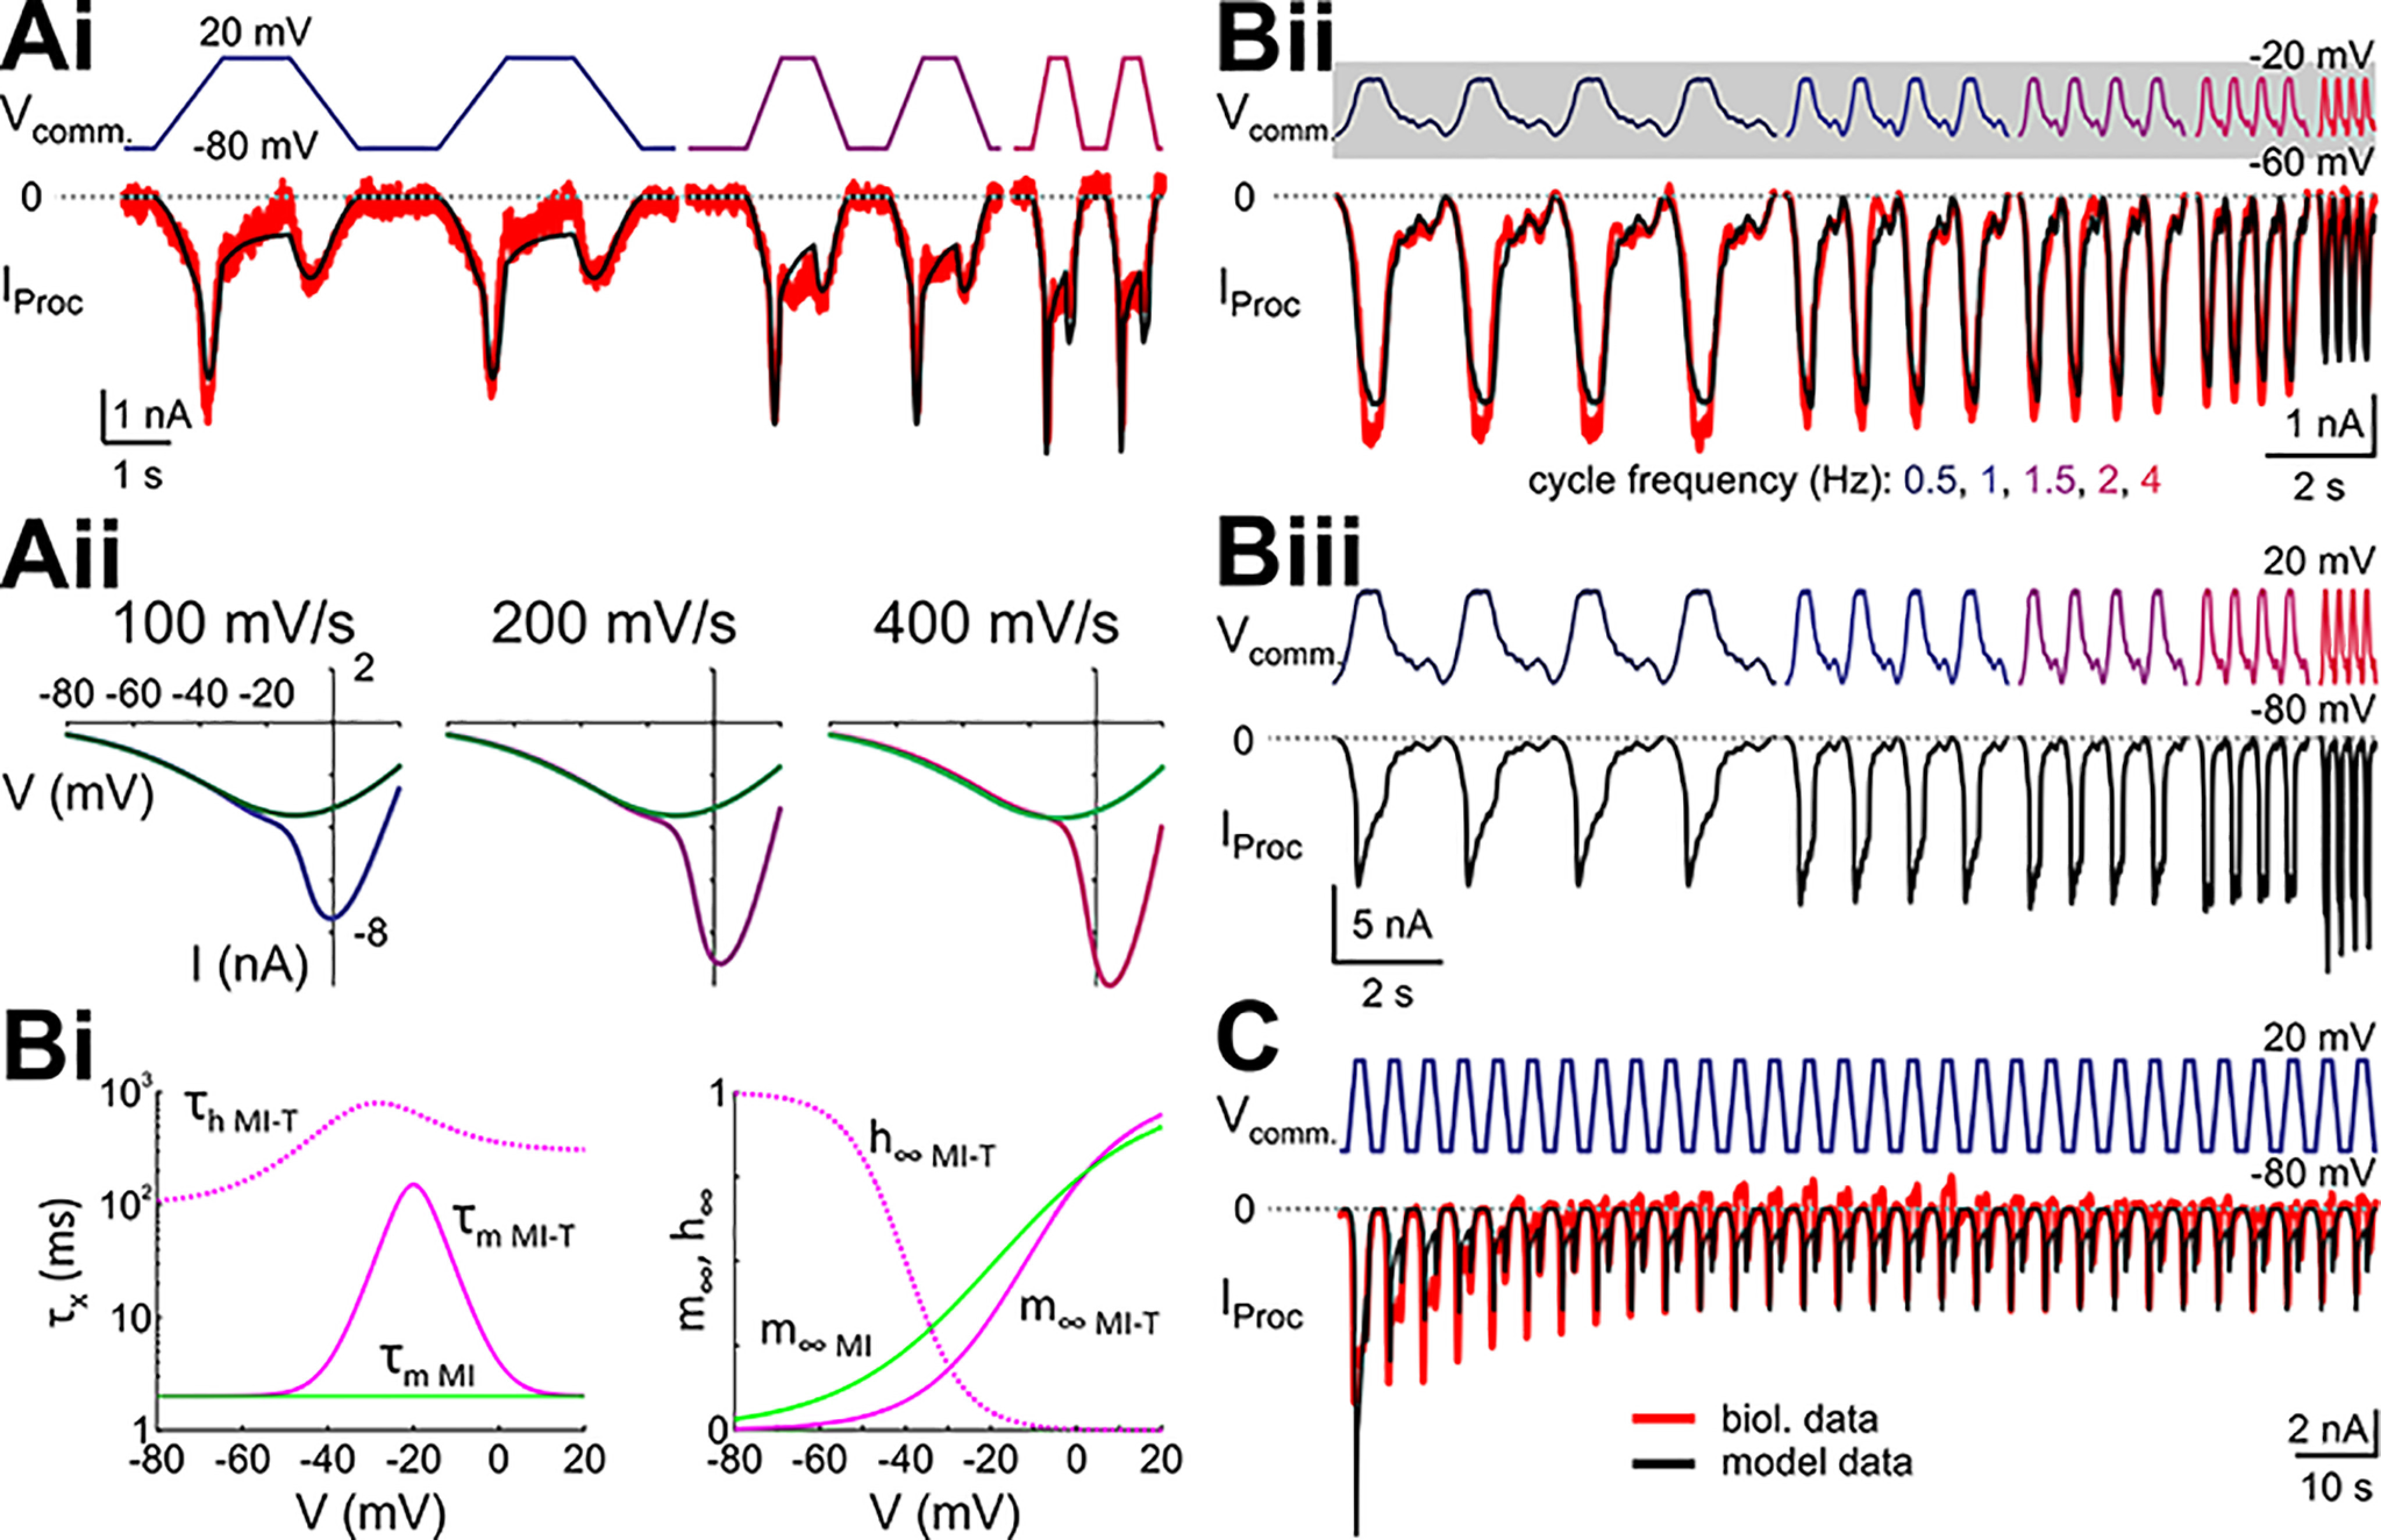
A model with only IMI and IMI-T adequately captures the fast and slow inactivations. A, Model parameters for IMI and IMI-T were tuned to capture the steady-state IProc trajectories, i.e., a larger inward current on the positive ramps, and larger inward currents with larger slopes. Ai, Overlay of the biological (red) and model (black) IProc trajectories in response to steady-state ramp-and-hold stimuli. Aii, I-V curves separated by positive (purple) and negative (green) ramps similar to those shown in Ai. I-V curves for the positive ramps were obtained after holding the voltage at –80 mV to remove inactivation, and the negative ramps after holding the voltage at +20 mV to maximize inactivation of the transient current. Bi, Time constants for the activation (solid lines) and inactivation (dashed lines) gates of the model IMI (green) and IMI-T (pink). Bii, Model response to realistic LP waveform stimulations with different cycle frequencies (based on the biological data from the same preparation as in Ai). The gray shading around Vcomm. indicates the voltage range of the ramp and ramp-and-hold stimuli used in Ai. Biii, Model response to the same waveforms as in Bii but with an upscaled amplitude that is similar to the amplitude of the ramp and ramp-and-hold stimuli. C, The slow inactivation of the proctolin-activated current can be mimicked in a computational model by modeling IMI-T as Ca2+ current following the Goldman–Hodgkin–Katz formalism.