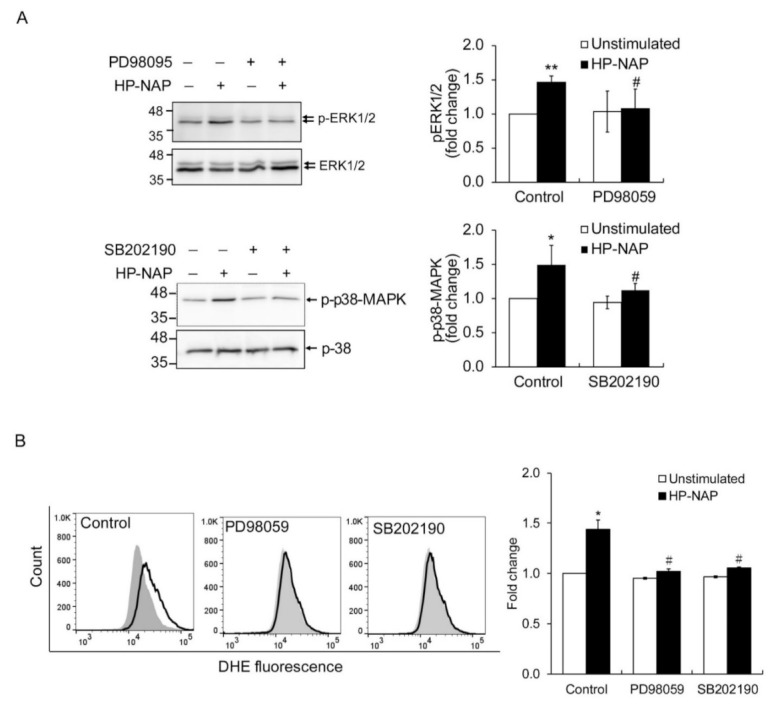
Figure 4.

The effect of MAPK inhibitors on MAPK phosphorylation and ROS production in ATRA-induced differentiated HL-60 cells in response to HP-NAP. (A) The inhibitory effect of MAPK inhibitors on HP-NAP-induced MAPK phosphorylation in ATRA-induced differentiated HL-60 cells. ATRA-induced differentiated HL-60 cells at a density of 5 × 10⁶ cell/mL were pretreated with 10 μM PB98059, 5 μM SB202190, or the vehicle control at 37 °C for 1 h and followed by the stimulation with 1 μM HP-NAP or D-PBS, pH 7.2, as the unstimulated control for 3 min to detect the phosphorylation of ERK1/2 or 1 min to detect the phosphorylation of p38-MAPK. Cells were lysed and whole cell lysates were applied to immunoblot analysis as described in Figure 3A. Quantitative data are expressed as the fold change as described in Figure 3A and as mean ± SD of four independent experiments. (B) The effect of MAPK inhibitors on HP-NAP-induced ROS production in ATRA-induced differentiated HL-60 cells. ATRA-induced differentiated HL-60 cells at a density of 4 × 10⁶ cells/mL were pretreated with MAPK inhibitors or the vehicle control as described in A and followed by the stimulation with 1 μM HP-NAP or D-PBS, pH 7.2, as the unstimulated control at 37 °C for 30 min. ROS production was measured as DHE-derived fluorescence detected by flow cytometry as described in Figure 2C. Representative histograms are shown in the left panel. Gray filled histograms represent the unstimulated control cells and black open histograms represent the HP-NAP-stimulated cells. Data in the right panel are expressed as the fold change of MFI by defining the MFI of DHE-derived fluorescence in the unstimulated control cells as 1 and as mean ± SD of three independent experiments. *: p value < 0.05, **: p value < 0.01 as compared with the unstimulated cells in each group; #: p value < 0.05 as compared with HP-NAP-stimulated cells in the control group.
