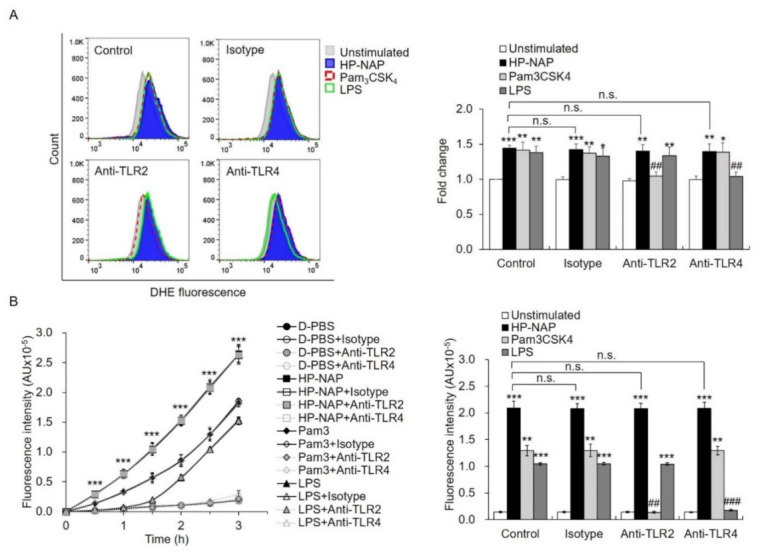
Figure 5.

The effect of TLR2-neutralizing antibodies on HP-NAP-induced ROS production by ATRA-induced differentiated HL-60 cells and neutrophils. (A) TLR2-independent ROS production in ATRA-induced differentiated HL-60 cells induced by HP-NAP. ATRA-induced differentiated HL-60 cells at a density of 4 × 10⁶ cell/mL were pretreated with 10 μg/mL of anti-TLR2, anti-TLR4, or IgG2a isotype antibodies at 37 °C for 30 min and followed by the stimulation with 1 μM HP-NAP, 1 μg/mL Pam3CSK4, 10 μg/mL LPS, or D-PBS, pH 7.2, as the unstimulated control at 37 °C for 30 min. ROS production was measured as DHE-derived fluorescence by flow cytometry as described in Figure 2C. Representative histograms are shown in the left panel. Data in the right panel are expressed as the fold change as described in Figure 2C and as mean ± SD of three independent experiments. (B) TLR2-independent ROS production in neutrophils induced by HP-NAP. Neutrophils at a density of 2 × 10⁶ cell/mL were pretreated with 10 μg/mL of anti-TLR2, anti-TLR4 or IgG2a isotype antibodies at 37 °C for 30 min and followed by the stimulation with 1 μM HP-NAP, 1 μg/mL Pam3CSK4, 10 μg/mL LPS or D-PBS, pH 7.2, as the unstimulated control for the indicated time. ROS production by neutrophils was determined by H2DCF-DA-derived derived fluorescence assay as described in Figure 2A. Data from neutrophils stimulated with HP-NAP for 2.5 h are shown as bar graph and expressed as mean ± SD of four independent experiments in duplicate. *: p value < 0.05, **: p value < 0.01, ***: p value < 0.001 as compared with the unstimulated cells. ##: p value < 0.01, ###: p value < 0.001 as compared with HP-NAP-stimulated cells in the isotype control group. n.s.: non-significant.
