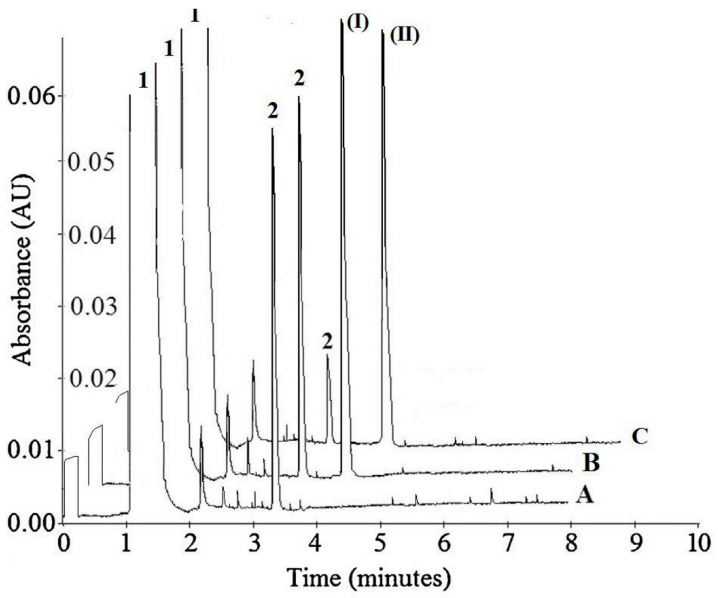
Figure 2.
Representative electrophoregrams of: (A) 1.44 mM of p-nitrophenyl phosphate (PN-TE) (1) and 0.018 mM of the reaction product p-nitrophenol (PN-OL) (2) in 2 mL of incubation sample; (B) 1.44 mM of PN-TE (1) and 0.018 mM of the reaction product PN-OL (2) in the presence of 0.05 mM of (I) in 2 mL of incubation sample; and (C) 1.44 mM of PN-TE (1) and 0.009 mM of the reaction product PN-OL (2) in the presence of 0.05 mM of (II) in 2 mL of incubation sample.

