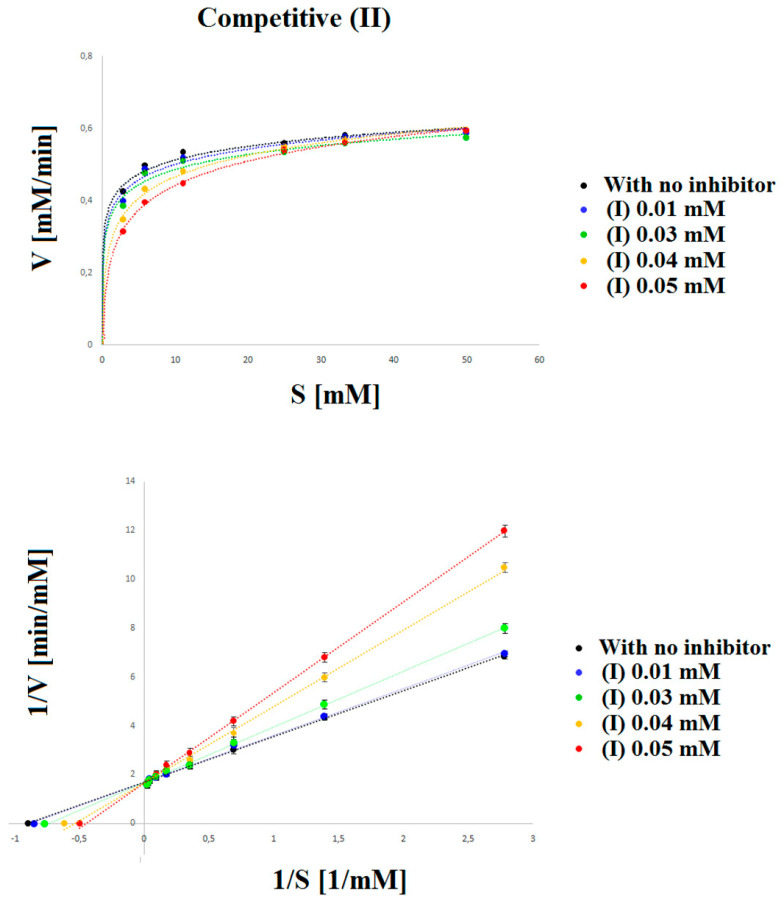
Figure 4.
Michaelis–Menten and Lineweaver–Burk plots for the reaction of acid phosphatase with p-nitrophenyl phosphate inhibited by: (•) 0.00 mM, (•) 0.01 mM, (•) 0.03 mM, (•) 0.04 mM and (•) 0.05 mM (II). The figure shows three straight lines with different intersection points with the 1/V axis and a common intersection with the 1/S axis. Such a system indicates the competitive type of inhibition. The larger the slope of the curve, the stronger the competitive inhibitor of the tested compound is.

