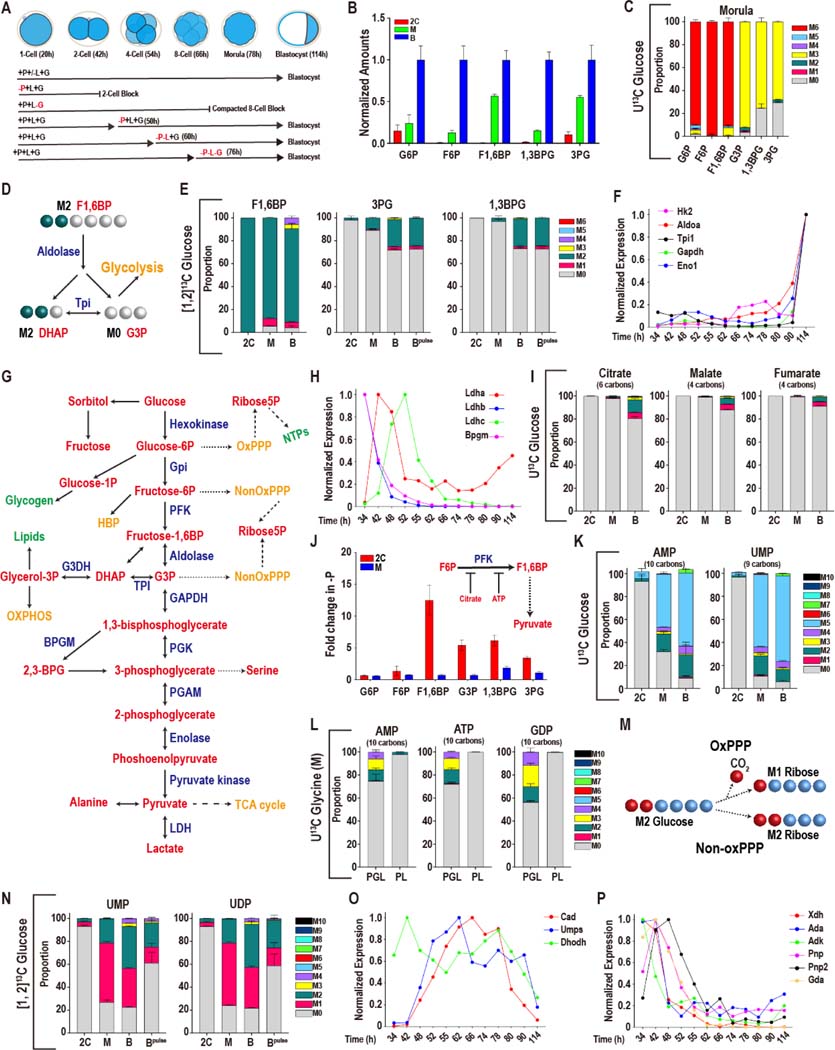
Figure 1. Glucose metabolism during preimplantation development.
In this and in all figures, times in hours (h) refer to time elapsed after human chorionic gonadotropin (hCG) injection that induces ovulation. Zygotes are isolated at 18–22h and cultured until the specified hours (h) post hCG. The metabolomic analysis is presented as scaled means ± SD and is obtained from 3 biological replicates. Each biological replicate contains more than 250 embryos. The RNA-seq analysis is presented as normalized values and is obtained from ~4 biological replicates of each of the 12 time-points that were analyzed. Each biological replicate contains RNA from 25 embryos.
(A) A schematic representation of developmental progression of mouse preimplantation embryos in the presence of different combinations of nutrients.
(B) Normalized amounts of glycolytic intermediates in 2C (48h), morula (M, 78h), and blastocysts (B, 96h). See Table S1 for non-normalized data.
(C) U-13C glucose contributes carbon to the glycolytic intermediates at the morula stage. The lower glycolytic intermediates (1,3BPG and 3PG) have a prominent unlabeled component (gray). Gray: M0 unlabeled; colors: labeled as marked. Note that the “fully labeled” color depends on the total carbons in the metabolite (e.g., fully labeled is M6 (red) for G6P, M3 (yellow) for 1,3BPG and 3PG).
(D) Schematic representing the fate of the 1 and 2 carbon of glucose at the aldolase reaction.
(E) [1, 2]-13C glucose contributes carbon to the upper glycolytic intermediates (F1,6BP) at the 2C, morula (M) and blastocyst (B) stages. The lower glycolytic intermediates (1,3BPG and 3PG) are largely unlabeled, with an increased contribution at the blastocyst stage. For the blastocyst samples, labeled glucose is provided at the zygote stage (B) or 26 h prior to extraction (Bpulse). Colors: labeled as marked.
(F, H) Expression of genes encoding glycolytic enzymes between early 2C (34h) and fully expanded blastocyst (114h) stages. (F) A majority of glycolytic enzymes increase in expression during later stages of development. (H) A subset is highest at the 2C stage and then declines.
(G) Schematic of glucose metabolism. Red = metabolites, blue = enzymes, green = products, orange = pathways.
(I) U-13C glucose only contributes minor amounts of carbon to TCA cycle metabolites, with a measurable contribution only at the blastocyst stage.
(J) The lower glycolytic intermediates (G3P, 1,3BPG and 3PG) increase in abundance in 2C embryos following pyruvate withdrawal, but not in morula. Inset: Schematic illustration of the inhibition of PFK activity by citrate and ATP.
(K) U-13C glucose contributes to nucleotide formation during development. The major isotopologue, M5 (blue) represents fully labeled ribose formation by glucose.
(L) U-13C glycine contributes to purine base synthesis in morulae (M) if glucose (U-12C) is present (PGL), but does not do so when glucose is withheld (PL).
(M) Schematic showing that when [1, 2]13C glucose is metabolized by the oxidative PPP, one labeled carbon is lost to CO2 formation and the ribose-5P formed is M1. When [1, 2]-13C glucose is metabolized by the non-oxidative PPP a carbon is not lost and the ribose-5P formed is M2.
(N) [1, 2]13C glucose contributes carbon to the pyrimidine nucleotides UMP and UDP at the morula (M) and blastocyst (B) stages. M1 (pink) indicates ribose formation by the oxidative PPP, and M2 (green) ribose formation via the non-oxidative PPP. For the blastocyst samples, labeled glucose is provided at the zygote stage (B) or 26 h prior to extraction (Bpulse).
(O, P) Expression of nucleotide metabolism genes. A majority of pyrimidine synthesis genes (O) increase in expression during the morula stage, whereas genes involved in purine degradation
(P) peak in expression during the 2C stage.

