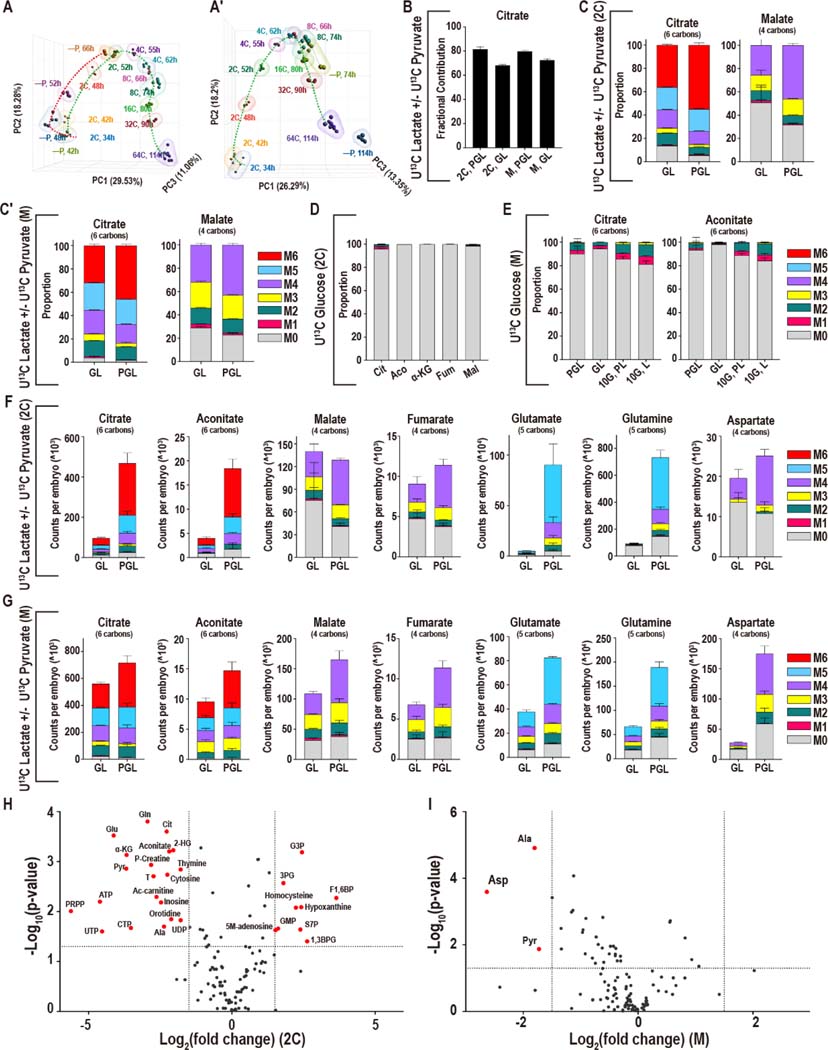
Figure 3. Adaptation to nutrient conditions.
(A-A′) Principal component analysis (PCA) analysis of genes that are directly involved in metabolic processes (1947 genes) in embryos developing with and without pyruvate. Pyruvate is removed from the zygote stage (A) or the late 2C stage (A′).
(B) In both 2C embryos and morulae, U-13C pyruvate/lactate contributes a majority of carbons to the total citrate pool in the presence (PGL) or absence (GL) of pyruvate.
(C, C′) At both the 2C (C) and morula (C′) stages, the isotopologues of citrate that are formed from U-13C lactate alone (no pyruvate is present, GL) are similar to the isotopologues that are formed when both U-13C pyruvate and U-13C lactate (PGL) are present.
(D, E) The contribution of U-13C glucose to the TCA cycle metabolites remains very low in 2C embryos (D) as well as in morulae (E) in GL media (lacking pyruvate), even when a high amount of glucose (10mM instead of the normal 0.2mM) is provided (10G, L).
(F, G) Formation of Class I metabolites from U-13C lactate/pyruvate decreases when pyruvate is withheld from 2C embryos (F), but less so in morulae (G). Fumarate and malate are less sensitive, and Asp only decreases significantly in morulae.
(H) In 2C embryos 20 metabolites decrease significantly, and 9 metabolites increase upon pyruvate withdrawal (GL). (I) In morulae, only Asp, pyruvate, and Ala decrease significantly. Metabolites are highlighted if P < 0.05 and the log2 fold-change > +/−1.5.
See also Figure S3.

