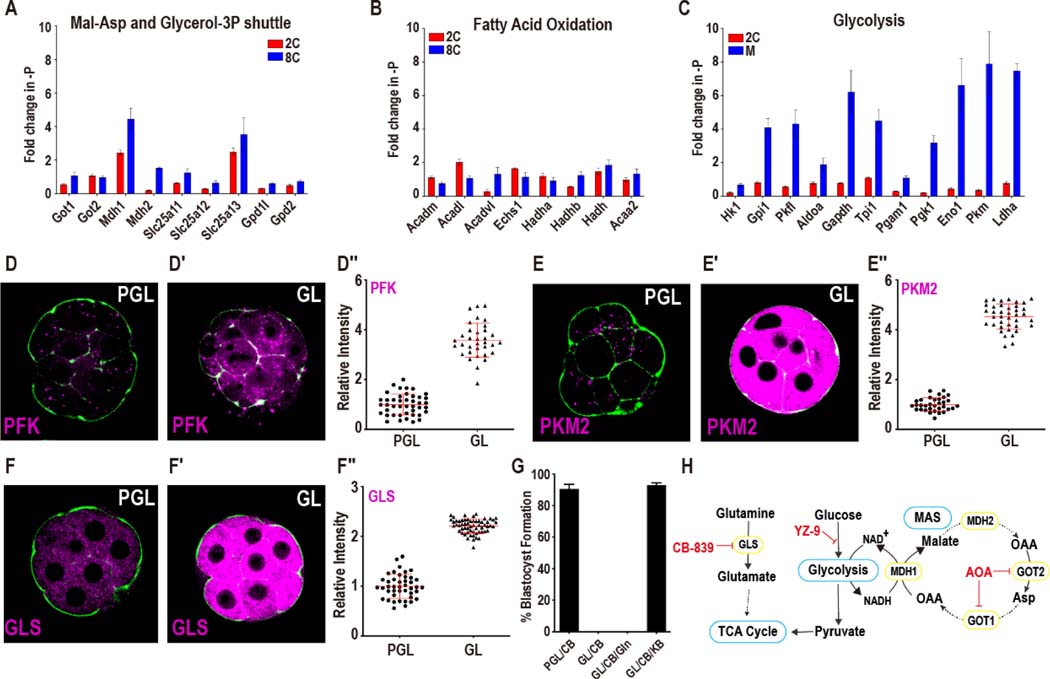
Figure 6. Metabolic response to reductive stress.
(A, B) Genes in the Mal-Asp shuttle and glycerol-3P shuttle (A), and mitochondrial beta-oxidation (B) do not show a concerted increase when pyruvate is withdrawn.
(C) The expression level of glycolytic genes increases in morulae, but not in 2C embryos.
(D-E′′) Upon pyruvate withdrawal, protein levels of the glycolytic enzymes PFK (D-D′′) and PKM2 (E-E′′) show significant increases. Data is presented as the mean +/− standard deviation (n = ~25 embryos).
(F-F′′) GLS protein increases when pyruvate is withheld. Data is presented as the mean +/− standard deviation (n = ~25 embryos).
(G) Glutaminase inhibition (200nM CB-839) does not block the development of embryos in PGL media. Embryos in GL media, however, block in development following CB-839 treatment. α-KB (1mM) suppresses the block, but Gln (1mM) does not.
(H) Schematic representing glycolysis, the Mal-Asp shuttle, glutamine metabolism and their inhibitors.
See also Figure S6.

