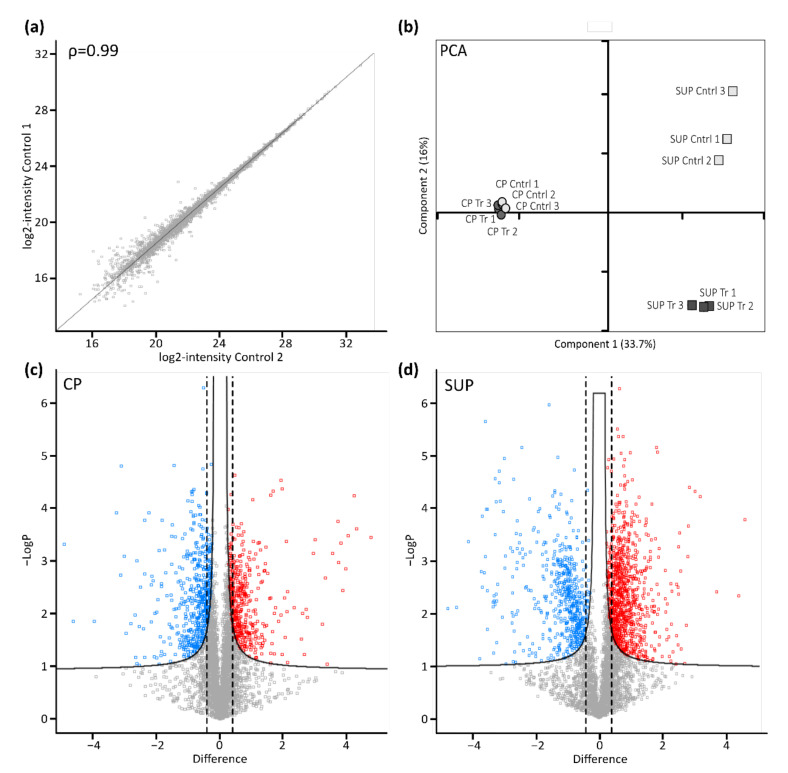
Figure 2.
Proteomic profiling of AAV expressing HEK293 cells. (a) Scatter plot shows correlation between biological replicates. Shown are log-transformed intensity values of cell pellet control samples 1 vs. 2 with a Pearson correlation of ρ = 0.99. (b) Principal component analysis (PCA) shows relationship between biological replicates (n = 3) and treatment condition (control: light grey; transfected: dark grey) for cell pellets (CP, circles) and cell culture supernatant (SUP, squares). (c,d) Transfected vs. untransfected cell pellet (CP) and supernatant (SUP) samples were compared using volcano plots with cut-off curves indicating significance determined by a two-sided t-test with a permutation-based FDR of 0.05 and S0 of 0.1 (n = 3). Additionally, a minimum fold change (= log2-transformed difference) of 1.5 was set as threshold for significance as indicated by the dashed lines. Significantly downregulated proteins are indicated in blue, upregulated proteins are shown in red.

