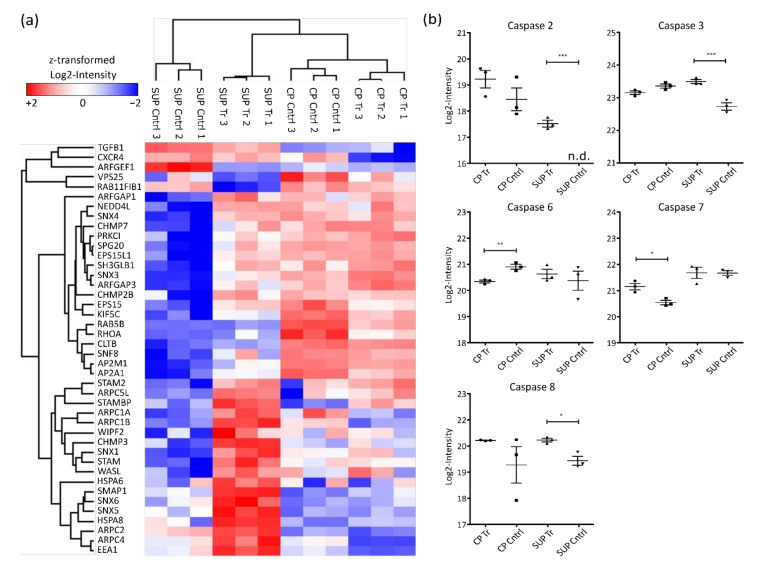
Figure 4.
Hierarchical clustering of significantly differentially expressed proteins involved in endocytosis (a) based on Euclidian distance. Shown are log2-intensities after z-transformation. Red indicates upregulation while blue shows downregulation of the corresponding proteins. (b) Log2-transformed LFQ intensity of identified caspases. Significance was determined using an ANOVA with a Tukey’s post-test (*** p ≤ 0.001; ** p ≤ 0.01; * p ≤ 0.05; n = 3).

