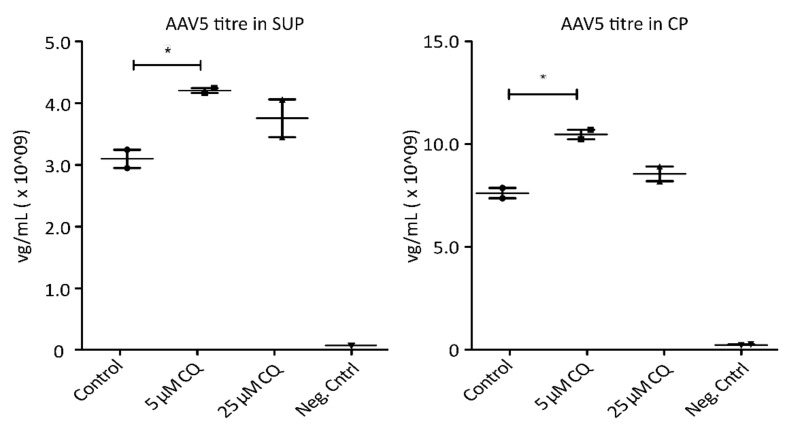
Figure 5.
AAV5 concentration in viral genomes per mL (mg/mL) 72 h post-transfection following chloroquine (QC) treatment. Shown are titers measured via qPCR in cell culture media (SUP, left) as well cell pellets (CP, right). Significance was determined using a two-tailed t-test comparing treated samples vs. control (* p ≤ 0.05; n = 3).

