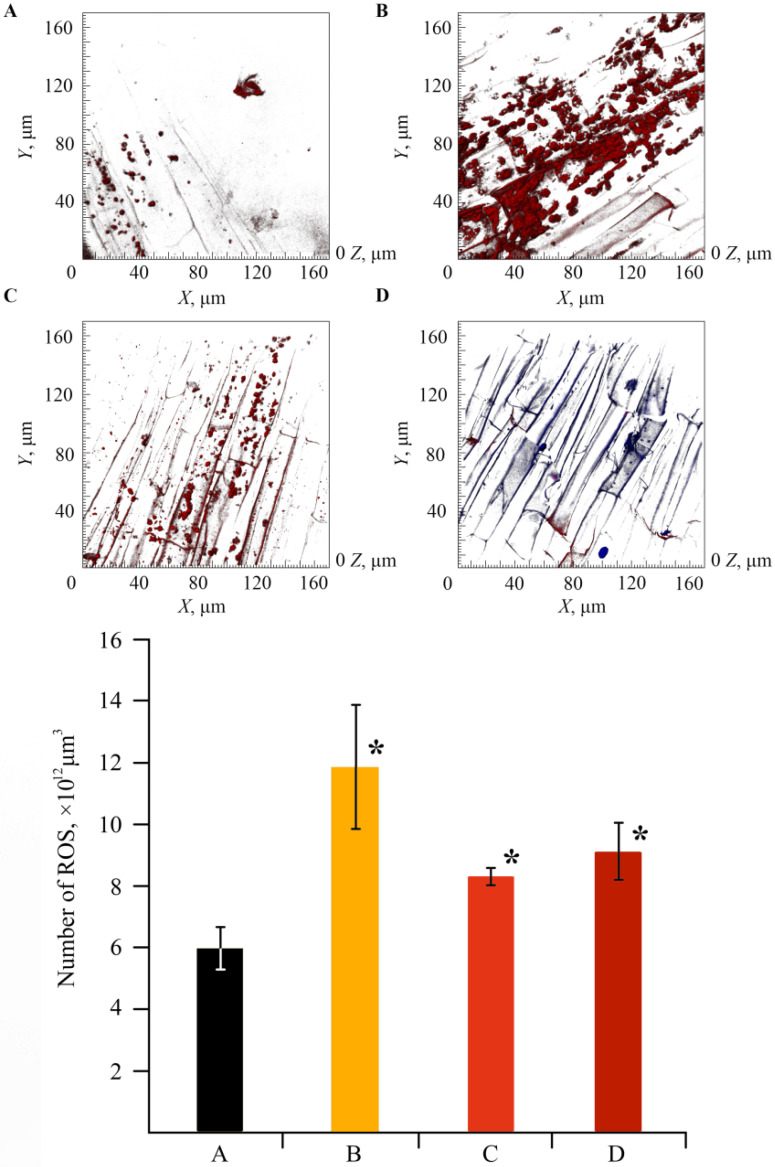
Figure 10.
Confocal laser scanning microscopy (CLSM) images of the effect of NCs on ROS production and respective data on the number of ROS in plant tissues in the control (A), infected by Cms (B), treated with NCs (C), treated with NCs and infected by Cms (D); * p ≤ 0.01 compared to the control according to the Mann–Whitney test.

