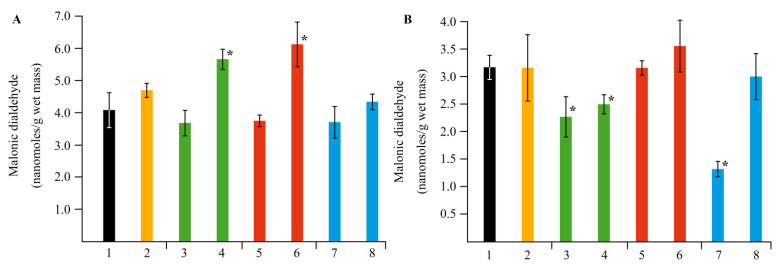
Figure 12.
Effect of NC treatments on the content of malonic dialdehyde (MDA) in potato leaves (A) and roots (B), in comparison with the control group in vitro, as well as in plants infected by Cms pathogen; (1)—control without NCs and Cms, (2)—plants infected by Cms without NCs, (3)—AG-Mn without Cms, (4)—infected plants in the presence of AG-Mn, (5)—AGS-Mn without Cms, (6)—infected plants in the presence of AGS-Mn, (7)—κ-CG-Mn without Cms, (8)—infected plants in the presence of κ-CG-Mn; * p ≤ 0.01 compared to the control according to the Mann–Whitney test.

