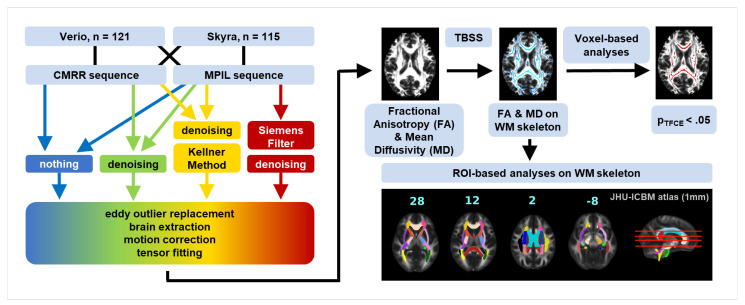
Figure 1.
Analysis outline. DW images were collected at 3T Siemens Magnetom Verio and Skyrafit with CMRR [57] and MPIL (Siemens product sequence) sequence respectively, resulting in four datasets. Each dataset from the MPIL sequence was processed with four different pipelines: no filtering (blue), denoising (green), denoising + unringing by “Kellner Method” (yellow) [48] and Siemens low-pass window filtering + denoising (red); datasets from the CMRR sequence were processed with three different pipelines (Siemens low-pass window filtering was not applied). Standard preprocessing steps followed these pre-filtering steps. By tensor fitting obtained FA and MD maps were skeletonised with tract-based spatial statistics (TBSS) [42] and fed into voxel-wise as well as ROI-based analyses on white matter (WM) skeleton.

