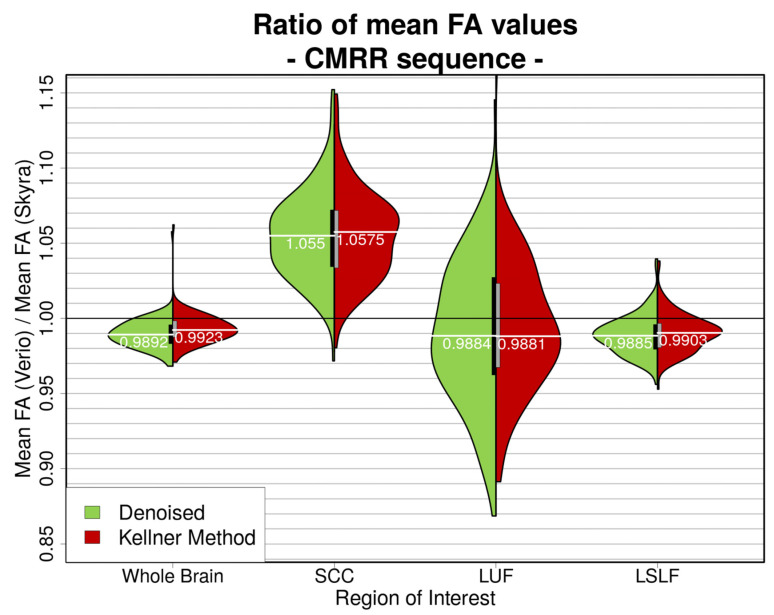
Figure 11.
Ratio of whole brain mean FA values (Verio divided by Skyra) in different ROIs. For better visual clarity, unfiltered data is not shown. The left, green part of the violins represents denoised data; the right, red part shows the ratios after denoising and unringing. Bayesian linear modelling delivered significant differences between ROIs: >> 2 × 10196 ± 1.15%. Mean FA ratios calculated after different preprocessing pipelines do not differ significantly: BF[mean FA ratio ~ preprocessing pipeline] = 0.6.

