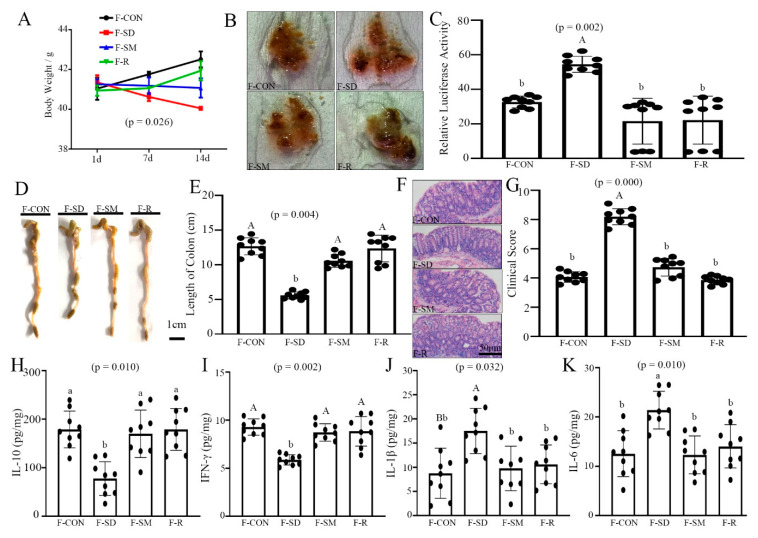
Figure 4.
FMT re-established the intestinal microecology similar to CON, SD, and SD + MLT mice. (A) Body weight; (B) fecal occult blood; (C) relative luciferase activity for colonic permeability; (D), (E) colonic length; (F) H&E staining photographs (scale: 50 μm); (G) histopathological score; (H–K): IL-10 (H), IFN-γ (I), IL-1β (J), IL-6 (K) concentrations in the colon of the F-CON, F-SD, F-SM, and F-R groups. Values are presented as the mean ± SE. Differences were assessed using ANOVA and are denoted as follows: different lowercase letters or different uppercase letters: p < 0.05; different letters and one contains uppercase letters and the other is lowercase letters: p < 0.01; same letter: p > 0.05.

