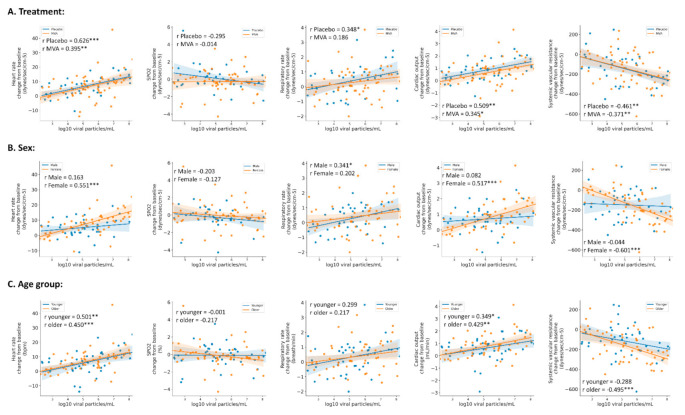
Figure 5.
Correlations between viral load and changes in physiological parameters during the third-day post-exposure. Pearson’s correlations between viral loads as measured by real-time PCR and mean changes in physiological parameters from the third-day post-exposure. The correlations were stratified based on treatment ((A) Placebo, blue dots/line; MVA, orange dots/line), sex ((B) male, blue dots/line; female, orange dots/line), and age ((C) younger, blue dots/line; older, orange dots/line). * p < 0.05, ** p < 0.01, *** p < 0.001.

