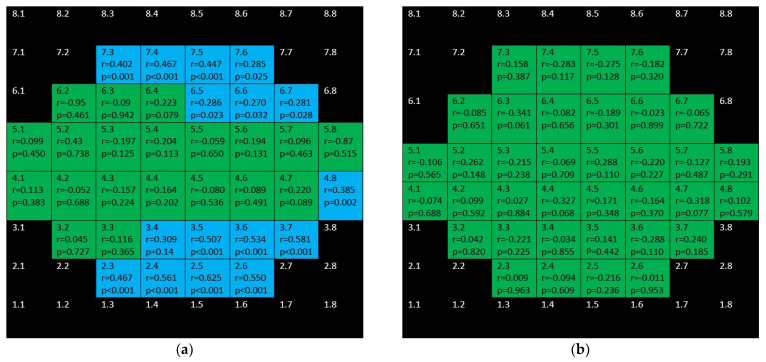
Figure 8.
Color map of correlations for macular retinal nerve fiber layer in the glaucoma group (a) and control group (b). Green color indicates non–significant correlation. Blue color indicates significant positive correlation. Red color indicates significant negative correlation. Black color indicates OCT superpixels not considered in the calcula-tions. R = Spearman’s rho, p = significance.

