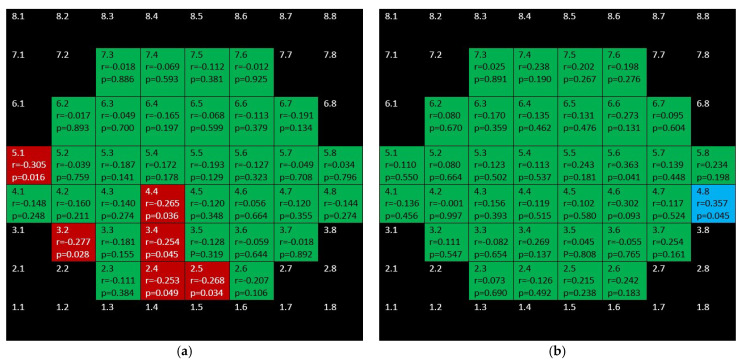
Figure 14.
Color map of correlations for outer retina layer in the glaucoma group (a) and control group (b). Green color indicates non-significant correlation. Blue color indicates significant positive correlation. Red color indicates significant negative correlation. Black color indicates OCT superpixels not considered in the calculations. r = Spearman’s rho, p = significance.

