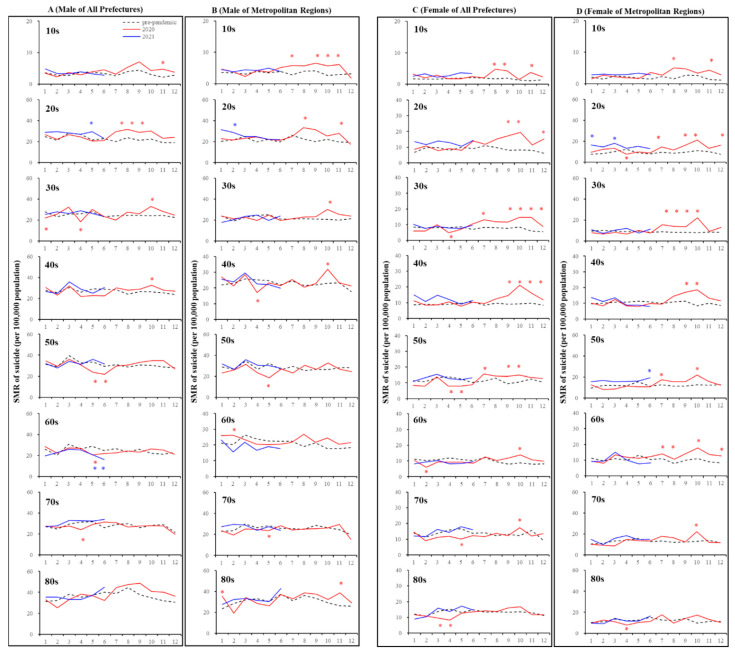
Figure 4.
Temporal fluctuations in monthly SMR-S disaggregated by gender, age, and regional factors during the COVID-19 pandemic period (2020–2021) compared to the average of SMR-S during the same month during the pre-pandemic period (2017–2019). Dotted black, red, and blue lines indicate the average of SMR-S for (A) males from all 47 prefectures, (B) males from metropolitan regions, (C) females from all 47 prefectures, and (D) females from metropolitan regions. Ordinates indicate the SMR-S (per 100,000 people), and abscissas indicate the month. * p < 0.05, significant change using a linear mixed-effects model with Tukey’s multiple comparison. Red and blue asterisks indicate significant changes in SMR-S in 2020 and 2021, respectively, compared to the average SMR-S of the same month during the pre-pandemic period.

